Articles
- Page Path
- HOME > J Prev Med Public Health > Volume 54(6); 2021 > Article
-
Original Article
Association Between Low Muscle Mass and Non-alcoholic Fatty Liver Disease Diagnosed Using Ultrasonography, Magnetic Resonance Imaging Derived Proton Density Fat Fraction, and Comprehensive NAFLD Score in Korea -
Hun Ju Lee1
 , Jae Seung Chang2, Jhii Hyun Ahn3, Moon Young Kim4, Kyu-Sang Park2, Yeon-Soon Ahn1, Sang Baek Koh1
 -
Journal of Preventive Medicine and Public Health 2021;54(6):412-421.
DOI: https://doi.org/10.3961/jpmph.21.387
Published online: October 22, 2021
1Department of Preventive Medicine, Yonsei Wonju University College of Medicine, Wonju, Korea
2Department of Physiology, Yonsei University Wonju College of Medicine, Wonju, Korea
3Department of Radiology, Wonju Severance Christian Hospital, Yonsei University Wonju College of Medicine, Wonju, Korea
4Department of Internal Medicine, Yonsei University Wonju College of Medicine, Wonju, Korea
- Corresponding author: Sang Baek Koh Department of Preventive Medicine, Yonsei Wonju University College of Medicine, 20 ilsan-ro, Wonju 26426, Korea E-mail: kohhj@yonsei.ac.kr
Copyright © 2021 The Korean Society for Preventive Medicine
This is an Open Access article distributed under the terms of the Creative Commons Attribution Non-Commercial License (http://creativecommons.org/licenses/by-nc/4.0/) which permits unrestricted non-commercial use, distribution, and reproduction in any medium, provided the original work is properly cited.
ABSTRACT
-
Objectives
- Non-alcoholic fatty liver disease (NAFLD) is an increasingly prevalent metabolic disease. Muscle is known to influence NAFLD development. Therefore, this study aimed to determine the relationships among low muscle mass, NAFLD, and hepatic fibrosis using various definitions of low muscle mass and NAFLD diagnostic methods, including magnetic resonance imaging-based proton density fat fraction (MRI-PDFF).
-
Methods
- This cross-sectional study included 320 participants (107 males, 213 females) from the Korean Genome and Epidemiology Study on Atherosclerosis Risk of Rural Areas in the Korean General Population cohort. Muscle mass was assessed using whole-body dual-energy X-ray absorptiometry and adjusted for the height squared, body weight, and body mass index (BMI). NAFLD was diagnosed using ultrasonography (US), MRI-PDFF, and the comprehensive NAFLD score (CNS). Hepatic fibrosis was assessed using magnetic resonance elastography. Multivariable logistic and linear regression analyses were performed to determine the aforementioned associations.
-
Results
- According to US, 183 participants (57.2%) had NAFLD. Muscle mass adjusted for body weight was associated with NAFLD diagnosed using US (odds ratio [OR], 3.00; 95% confidence interval [CI], 1.70 to 5.31), MRI-PDFF (OR, 2.00; 95% CI, 1.13 to 3.53), and CNS (OR, 3.39; 95% CI, 1.73 to 6.65) and hepatic fibrosis (males: β=-0.070, p<0.01; females: β=-0.037, p<0.04). Muscle mass adjusted for BMI was associated with NAFLD diagnosed by US (OR, 1.71; 95% CI, 1.02 to 2.86) and CNS (OR, 1.95; 95% CI, 1.04 to 3.65), whereas muscle mass adjusted for height was not associated with NAFLD.
-
Conclusions
- Low muscle mass was associated with NAFLD and liver fibrosis; therefore, maintaining sufficient muscle mass is important to prevent NAFLD. A prospective study and additional consideration of muscle quality are needed to strengthen the findings regarding this association.
- Non-alcoholic fatty liver disease (NAFLD) is a hepatic manifestation of steatosis not caused by alcohol consumption, ranging from simple steatosis to non-alcoholic steatohepatitis [1]. NAFLD can progress to advanced fibrosis, liver cirrhosis, and hepatocellular carcinoma, resulting in a higher mortality rate in patients with NAFLD than that in the general population. The prevalence of NAFLD, along with that of metabolic syndrome, which involves the combination of obesity, diabetes, and hypertension, has been increasing over the years. In 2004, one-third of adults had hepatic steatosis in the United States [2], and the NAFLD prevalence in Korea at the time of this study was 30.3% (males, 41.1%; females, 20.3%), reflecting a slight increase compared with previous rates [3]. Therefore, due to its high prevalence and relationship with severe diseases such as cirrhosis, NAFLD is an important contributor to chronic liver disease.
- Low muscle mass is a component of sarcopenia, a geriatric syndrome characterized by age-related decreases in skeletal muscle mass, muscle strength, and physical performance [4]. Sarcopenia is associated with a low quality of life, impaired cardiopulmonary performance, and high mortality in old people. Globally, the prevalence of sarcopenia is 10% [5]. The Asian Working Group for Sarcopenia (AWGS) and European Working Group on Sarcopenia in Older People (EWGSOP) recommended that sarcopenia be targeted by interventions due to its impacts on various health conditions [6,7].
- Recent studies have indicated that low muscle mass is a risk factor for NAFLD [8-10]. NAFLD and sarcopenia share pathological mechanisms, including insulin resistance and a systematic inflammatory response [11]. Contrary to the conventional perception that the skeletal muscle system includes only motor organs, it also includes endocrine organs that control insulin resistance. Muscle cells are responsible for the absorption and excretion of blood sugar in response to insulin. Decreases in muscle cells increase insulin resistance [12]. These changes affect liver metabolism, promote hepatocyte lipogenesis, and induce NAFLD.
- Many studies have aimed to determine the relationship between low muscle mass and NAFLD. However, the results of these studies are inconsistent; some studies reported that low muscle mass was associated with NAFLD [8-10], while others did not [13,14]. According to a recent study, this discrepancy in results can be interpreted as resulting from differences in the definitions of muscle mass and NAFLD [15]. In particular, the manner in which the appendicular skeletal muscle (ASM) system is adjusted critically affects the results. Therefore, we examined the association between low muscle mass and NAFLD using various definitions, including height-adjusted, body mass index (BMI)-adjusted, and weight-adjusted ASM, and diagnostic methods, including magnetic resonance imaging-based proton density fat fraction (MRI-PDFF), ultrasonography (US), and the biochemical NAFLD score.
INTRODUCTION
- Study Population
- We used data from the Korean Genome and Epidemiology Study on Atherosclerosis Risk of Rural Areas in the Korean General Population (KoGES-ARIRANG). KoGES, a population-based prospective cohort, was conducted to assess the prevalence, incidence, and risk factors of chronic diseases. Between 2005 and 2011, a total of 21 715 adults aged 40-70 were enrolled in this cohort, and a comprehensive health assessment, including a self-administered survey, physical examination, and blood test, was performed [16]. KoGES-ARIRANG is a sub-cohort of the KoGES for participants residing in Wonju and Pyeongchang. A total of 5178 participants (2127 males and 3501 females) were included in the baseline survey, and 3862 participants were followed up [17].
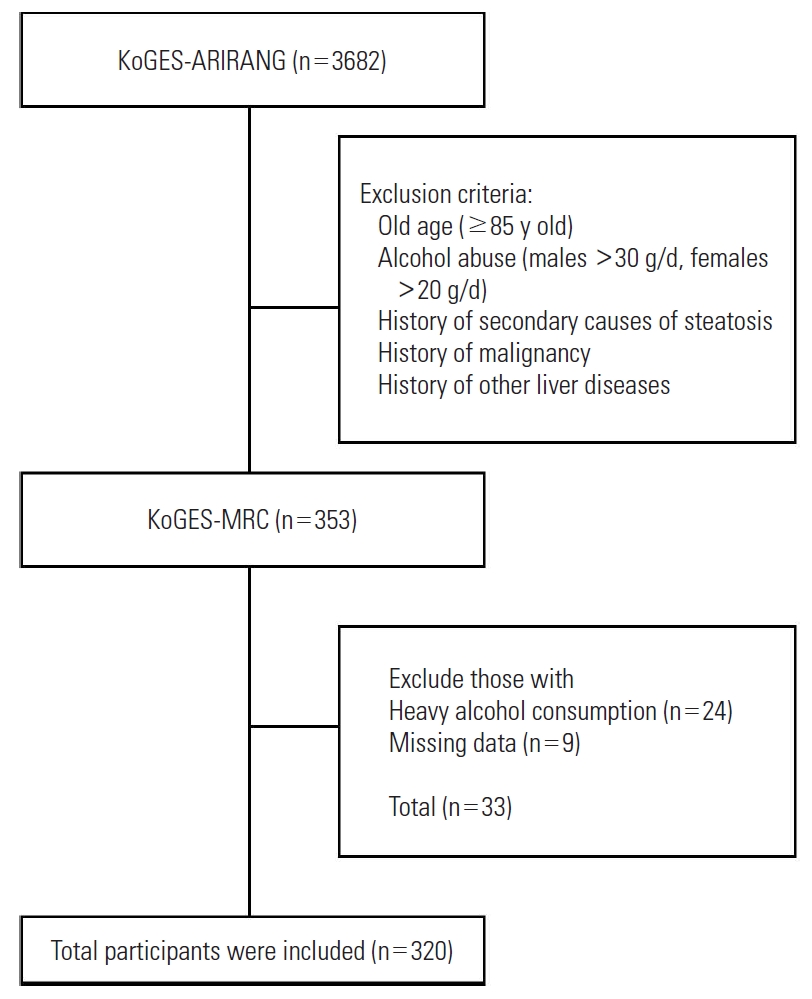
- Between May 2018 and August 2019, the KoGES-ARIRNG conducted further cross-sectional NAFLD and sarcopenia assessments. Participants who had a clinical history of secondary causes of steatosis and alternative diseases were excluded. Exclusion criteria were old age (≥85 years old), alcohol abuse (males: >30 g/d; females: >20 g/d), and a history of malignancy, chronic viral hepatitis (hepatitis B or C), drug-induced liver injury, autoimmune liver disease, and Wilson disease. A total of 353 people who agreed to participate in this study were recruited through e-mail and telephone. Various anthropometric and clinical assessments, including MRI-PDFF, abdominal US, and whole-body dual-energy X-ray absorptiometry (DXA), were conducted.
- We selected participants who underwent additional NAFLD and sarcopenia assessments for analysis. Using previous cohort questionnaire data, we further excluded alcohol abusers to exclude the impact of alcohol on liver disease occurrence (n=24). Those who had missing data on main variables, including MRI-PDFF results, were also excluded (n=9). Finally, 320 participants (107 males and 213 females) were included in the analysis (Figure 1).
- Magnetic Resonance Imaging-based Proton Density Fat Fraction, Magnetic Resonance Elastography, and Dual-energy X-ray Absorptiometry Measurements
- MRI-PDFF was performed using a 3-T system (Magnetom Skyra; Siemens, Erlangen, Germany) equipped with a combination of a 30-channel body and 32-channel spine matrix coils. To evaluate liver fat and iron content, multi-echo Dixon mapping was performed. MRI-PDFF maps and screening and multiecho Dixon reports were automatically acquired. Magnetic resonance elastography (MRE) was used to evaluate hepatic fibrosis. Continuous longitudinal mechanical waves at 60 Hz were generated using an acoustic pressure wave-transmitting driver device on the anterior chest wall. Two trained experts with 5 years and 6 years of MRE experience manually drew the regions of interest on each slice of the MRE images. The mean values of the results obtained by the 2 experts were analyzed. There was a 2-week interval between measurements, and readers were blinded to participant data. Appendicular muscle mass was assessed using DXA (Hologic Horizon W; Hologic Inc., Malborough, MA, USA).
- Clinical and Laboratory Index Measurements
- To assess biochemical parameters and NAFLD-related biomarkers, blood samples were obtained from the antecubital vein following fasting for more than 10 hours. A calibrated Roche Cobas® 8000 modular analyzer (Roche, Mannheim, Germany) was used to measure serum concentrations. A liver function test assessing aspartate and alanine aminotransferase and gamma-glutamyltransferase levels and a lipid profile test assessing serum total and high-density lipoprotein cholesterol, low-density lipoprotein cholesterol, triglyceride, and uric acid levels were performed. Insulin resistance-related markers, including fasting blood glucose, hemoglobin A1c, and fasting insulin, were also measured. Anthropometric measurements were performed by trained experts, and participants wore lightweight clothing during the examinations. Height, weight, and waist and hip circumferences were measured. BMI was calculated as weight (kg) divided by height squared (m2).
- Definitions of Non-alcoholic Fatty Liver Disease and Hepatic Fibrosis
- We defined NAFLD using US, MRI-PDFF, and the comprehensive NAFLD score (CNS). The US assessment was classified into 4 grades (no fatty change, mild, moderate, severe), with the last 3 grades being considered as NAFLD. US measurements were conducted by trained experts. On MRI-PDFF, NAFLD was defined as a fat composition >6.4% [18]. CNS was calculated according to the equation proposed by Lee [19], and the cut-off score was 40. The equation is presented in Supplemental Material 1. The degree of hepatic fibrosis was considered as the average of 2 measurements on MRE.
- Low Muscle Mass Definition
- ASM was measured using whole-body DXA. To compare parameter effects, we used 3 ASM adjustment factors: height, weight, and BMI. The first adjustment, height-adjusted ASM (kg/m2), was calculated by dividing ASM by height squared. The AWGS selected height-adjusted ASM as a diagnostic criterion for sarcopenia in 2014, with cut-off points of 7.0 kg/m2 in males and 5.4 kg/m2 in females [20]. We classified low muscle mass according to the suggestion of AWGS. The second parameter was the skeletal muscle mass index (SMI), which was calculated by dividing ASM by body weight (SMI=ASM/body weight×100[%]). Cut-off points were determined by 2 standard deviations (SDs) below the sex-specific mean of healthy young adults in Korea; accordingly, an SMI (%) <29.0 in males and <22.9 in females was considered as low muscle mass [21]. The BMI-adjusted ASM (m2) was calculated by dividing ASM by BMI. According to the suggestion of the Foundation for the National Institutes of Health Sarcopenia project, the low muscle mass cut-off points were <0.789 in males and <0.521 in females [22].
- Adjusted Variables Definition
- Cohort data were used for items related to the socioeconomic status, health habits, and metabolic diseases status of patients. Data were collected using a self-administered questionnaire. The education level was surveyed at 9 levels and classified as follows: below elementary school, middle school, high school graduation, and university and above. Hypertension was defined as a systolic blood pressure ≥140 mmHg, diastolic blood pressure ≥90 mmHg, or a previous hypertension diagnosis by a physician. Diabetes was defined as a fasting blood glucose level ≥126 g/dL or a previous diagnosis of diabetes by a physician. Patients were considered to have dyslipidemia if they were previously diagnosed by a physician.
- Statistical Analysis
- Continuous and categorical variables were presented as means with SD and as number and percentages, respectively. The t-test was used to compare the means of continuous variables, and the chi-square test was used to compare the proportions of categorical variables. The association between NAFLD and muscle mass was assessed using a hierarchical logistic regression analysis. Three models were used. Model1 was adjusted for age and sex; model 2 was adjusted for education, regular exercise, smoking, and drinking, as well as model 1; and model 3 was adjusted for hypertension, diabetes mellitus, and dyslipidemia, as well as the previous models. When muscle mass was adjusted for height, BMI was further adjusted for all models. Since only males smoked, smoking status was adjusted only for males. The association between muscle mass and hepatic fibrosis was analyzed using a multivariable linear regression analysis stratified by sex. As with the analysis of NAFLD, all models further adjusted for BMI when height adjustment was used. All statistical analyses were conducted using SAS version 9.4 (SAS Institute Inc., Cary, NC, USA). A p-value <0.05 was considered to indicate statistical significance.
- Ethics Statement
- All participants provided written informed consent, and the study protocol was approved by the Institutional Review Board of Wonju Severance Christian Hospital (approval No. CR320120). This study was conducted in accordance with the ethical standards of the Declaration of Helsinki.
METHODS
- Participant Characteristics According to Non-alcoholic Fatty Liver Disease Status
- Between May 2018 and August 2019, a total of 320 participants were enrolled, of whom 183 (57.2%) were diagnosed with NAFLD using US. A total of 125 participants (39.1%) were diagnosed with NAFLD using MRI-PDFF, and 225 participants (70.3%) were diagnosed with NAFLD using CNS (Supplemental Material 2). The diagnostic differences in each method were presented with a Venn diagram (Supplemental Material 3). Of the 320 people, 246 (76.9%) were diagnosed with NAFLD using at least 1 method, and 108 people (33.8%) were diagnosed using all 3 methods.
- Table 1 presents the baseline patient characteristics. Fifty-seven (39.6%), 107 (59.8%), and 148 (63.0%) participants had low muscle mass adjusted for height, BMI, and body weight in the NAFLD group, respectively. Furthermore, 87 (60.4%), 72 (40.2%), and 87 (37.0%) participants had low muscle mass adjusted for height, BMI, and body weight in the non-NAFLD group, respectively. The mean age of participants was 67.22±6.70 years and 65.70±7.58 years in the NAFLD and non-NAFLD groups, respectively. Of the 320 people, 272 (85.0%) were diagnosed with low muscle mass using at least 1 method, and 87 (27.2%) people were diagnosed using all 3 methods (Supplemental Material 4).
- Association Between Low Muscle Mass and Non-alcoholic Fatty Liver Disease
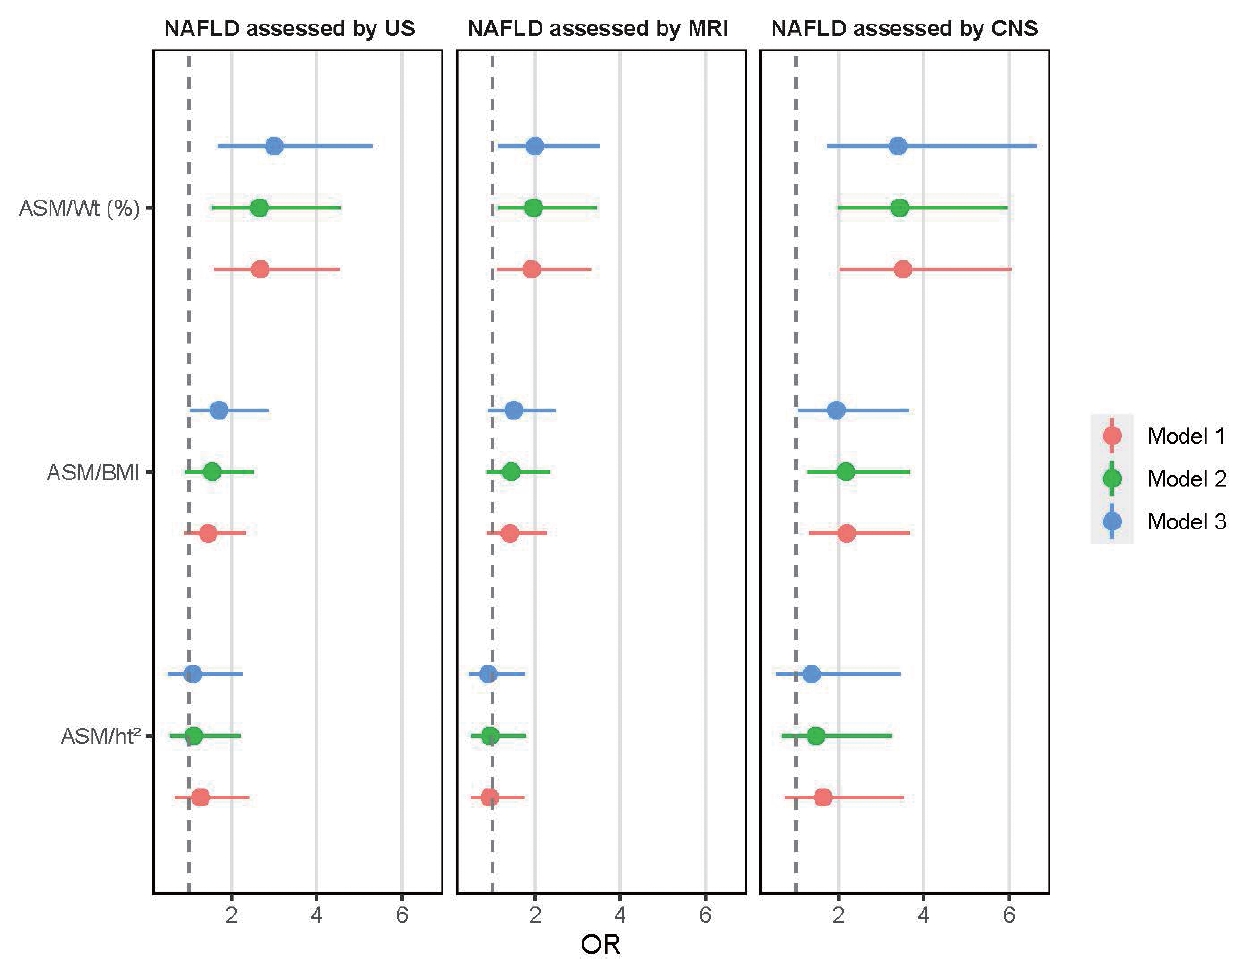
- We conducted multivariable logistic analyses to determine the association between low muscle mass and NAFLD (Table 2 and Figure 2). NAFLD diagnosed by US was associated with low muscle mass adjusted for BMI (odds ratio [OR], 1.71; 95% confidence interval [CI], 1.02 to 2.86) and body weight (OR, 3.00; 95% CI, 1.70 to 5.31). However, muscle mass adjusted for height was not associated with NAFLD (OR, 1.09; 95% CI, 0.53 to 2.26). In patients with NAFLD diagnosed using MRI, only body weight-adjusted muscle mass was associated with NAFLD (OR, 2.00; 95% CI, 1.13 to 3.53). NAFLD diagnosed using CNS was associated with low muscle mass adjusted for BMI (OR, 1.95; 95% CI, 1.04 to 3.65) and body weight (OR, 3.39; 95% CI, 1.73 to 6.65). Furthermore, when the low muscle mass group was divided based on median values, more NAFLD patients were included in the severe low muscle mass group with all 3 adjustment methods (Supplemental Material 5).
- Participant Characteristics According to Fibrosis Status
- Supplemental Material 6 shows the study participant characteristics when dividing participants into 2 even groups. The cut-off point was 2.087 kPa, and a high score indicated severe fibrosis. Sixty-five (45.1%), 103 (57.5%), 129 (54.9%) participants had low muscle mass in the high-score group when assessed using height, BMI, and weight adjustment, respectively. Statistically significant differences in low muscle mass participants between the high-score group and low-score group were found with adjustments for BMI (p=0.002) and weight adjustment (p=0.004), but not with adjustment for height (p=0.116). The mean of ASM was 16.0±4.0 kg in the high-score group and 14.2±3.3 kg in the low-score group. In addition, the high-score group showed a higher BMI and higher proportions of smoking and diabetes than the low-score group.
- Associations Between Low Muscle Mass and Fibrosis
- We conducted multivariable logistic regression analyses to determine the association between low muscle mass and hepatic fibrosis (Table 3). A separate analysis was conducted for males (n=107) and females (n=213). Appendicular muscle mass adjusted for body weight only was only associated with hepatic fibrosis (males: β=-0.070, p<0.01; females: β=-0.037, p=0.04). As muscle mass adjusted for BMI decreased, hepatic fibrosis increased, but this association was statistically insignificant in both sexes (males: β=-0.828, p=0.20; females: β=-0.538, p=0.35). Muscle mass adjusted for height was significantly associated with hepatic fibrosis, but this association was not statistically significant in either sex (males: β=-0.093, p=0.34; females: β=-0.009, p=0.91).
RESULTS
- In this study, we observed that muscle mass adjusted for BMI and body weight was associated with NAFLD assessed using US and CNS. Moreover, muscle mass adjusted for BMI and body weight was associated with hepatic fibrosis. This association was significant after adjustment for socioeconomic status, health habits, metabolic diseases, and insulin resistance. However, NAFLD assessed using MRI showed statistically significant results only with weight adjustment. Muscle mass adjusted for height was also statistically insignificantly associated with NAFLD and hepatic fibrosis.
- Inconsistent results have been reported regarding the association between muscle mass and NAFLD, with differences in muscle mass adjustment methods considered to be the main reason for this [15]. Because muscle mass is affected by height and weight, adjustment is required. However, there is no established adjustment method yet. These 3 adjustment methods were widely used in studies assessing the association between muscle mass and other chronic diseases. Therefore, in this study, the association between muscle mass and NAFLD was analyzed using 3 muscle mass variables adjusted for height, BMI, and body weight. Consequently, muscle mass adjusted for BMI and body weight was associated with NAFLD, but that adjusted for height was not, which is consistent with the results of other studies. Hong et al. [14] showed that in patients with chronic obstructive pulmonary disease, muscle mass adjusted for body weight (OR, 2.25; 95% CI, 1.30 to 3.92) and for BMI (OR, 1.95; 95% CI, 1.11 to 3.46) showed statistically significant associations with NAFLD, whereas muscle mass adjusted for height was not (OR, 1.06; 95% CI, 0.67 to 1.68). Peng et al. [15] also showed that the weight-adjusted SMI was associated with mild hepatic steatosis (OR, 1.41; 95% CI, 1.09 to 1.83), where as the height-adjusted SMI had an inverse association with the aforementioned steatosis (OR, 0.63; 95% CI, 0.48 to 0.83).
- The differences in results between adjustment methods are thought to be due to the disease development mechanism, especially fat accumulation. Although the exact mechanism has not been precisely elucidated, adipose-muscle-liver crosstalk has been identified as the main mechanism by which muscle mass affects the development of NAFLD [23]. Adipose tissue secretes bioactive substances termed adipokines, including adiponectin and leptin. Adiponectin activates 5’-adenosine monophosphate-activated protein kinase to promote insulin sensitivity and restrain cell apoptosis, and its receptors are distributed in liver and muscle cells [24]. Fat accumulation reduces adiponectin secretion and increases insulin resistance. Leptin, another major adipokine, also increases insulin resistance and inflammation [25]. Skeletal muscles secrete myokines, just as adipose tissue secretes adipokines. Myostatin, a myokine, is a member of the transforming growth factor-beta superfamily and promotes inflammation and fibrosis in the liver through activin IIb receptors [25]. Myonectin also promotes free fatty acid accumulation in adipose tissue and liver, inducing NAFLD incidence and progression [26].
- In this process, adipokine reduction acts not only on the liver, but also on muscle cells, reducing muscle anabolism and promoting lipid uptake [27]. This accumulation of excess fat in skeletal muscles, including intramuscular or intermuscular fat, is a pathological phenomenon called myosteatosis. Myosteatosis alters muscle fiber properties from type II to type I [28] and may also affect people without sarcopenia. Because of this close interaction between adipose and muscle and the effect of adipose tissue on NAFLD incidence, using obesity-related variables, such as BMI and weight, for muscle mass adjustment rather than adjusting for height seemingly strengthens the association between muscle mass and NAFLD. Furthermore, there were more NAFLD patients with severely low muscle mass even with height adjustment (Supplemental Material 5). Similarly, Lim et al. [29] argued in 2010 that body weight adjustment was more useful for predicting metabolic disease than height adjustment. To consider changes in muscle characteristics that occur in the stage before sarcopenia, muscle quality needs to be considered.
- The methods used to assess NAFLD also affect the results of the analysis. US is the standard method of diagnosing NAFLD. Due to its low risk and cost, it has been widely used for various purposes, from health check-ups to research, instead of invasive hepatic biopsy. US uses image brightness and ultrasound attenuation to measure the degree of steatosis. Although such evaluations are clinically useful, they have the disadvantages of being subjective and having low sensitivity for mild steatosis. MRI-PDFF is a recently developed method using signals from protons in mobile molecules. It provides more accurate and reproducible quantitative data by calculating the fat fraction in each liver segment [30]. MRI-PDFF has higher sensitivity than US and CNS, especially for mild steatosis, resulting in more patients with mild steatosis being classified as having NAFLD. These early NAFLD patients had a smaller association with sarcopenia, so the OR of MRI-PDFF was lower than that of other methods. Nevertheless, we found that NAFLD assessed using MRI showed statistically significant results for weight-adjusted ASM. Lastly, CNS uses a validated equation to diagnose NAFLD. This equation includes many characteristics and blood test results associated with metabolic syndrome; therefore, the results from CNS show a stronger relationship with chronic diseases. Because sarcopenia is associated with other chronic diseases such as diabetes mellitus, hypertension, and osteoporosis, CNS showed a larger effect size than US and MRI-PDFF in our study. Furthermore, when using CNS, most people (n=225) were diagnosed with NAFLD, and 52 (23.1%) of them were not diagnosed using other methods. This diagnostic inconsistency results from the fact that CNS does not directly reflect the state of hepatic steatosis, resulting in low sensitivity.
- To our knowledge, this study is the first to measure the association between NAFLD and low muscle mass in adults using MRI-PDFF. In children, Yodoshi et al. [31] revealed that there was an association between higher steatosis scores and low muscle mass index (OR, 0.73; 95% CI, 0.56 to 0.96). In their study analyzing the association between adverse muscle composition and metabolic disease, Linge et al. [32] found that the prevalence of sarcopenia was lower in the NAFLD (1.6%) than in the non-NAFLD group (3.4%).
- This study has several limitations. First, since this was an observational cross-sectional study, the findings are limited in terms of indicating a causal relationship between muscle mass and NAFLD. Second, the sample size was small (n=320). However, BMI was statistically significantly associated with the body-weight adjusted muscle mass, despite the wide CI, which is consistent with the results of other studies. Third, although hepatic biopsy is the gold standard for NAFLD diagnosis, we did not perform biopsies because it is an invasive technique that is not appropriate to perform in people who have only been identified as being at risk for NAFLD. We used various non-invasive and verified diagnostic methods. Fifth, muscle mass measurements using DXA may be inaccurate in obese patients due to myosteatosis. Muscle quality measurements using computed tomography may be an alternative.
- Our study has several strengths. First, we used cohort data to determine the amount of alcohol intake and cardiovascular disease prevalence. The cohort data were collected over 10 years and are therefore highly reliable. Second, by using alcohol intake data, we were able to eliminate drinking-induced diseases. Third, various adjustment methods and diagnostic tools were used to measure muscle mass and NAFLD. The results allowed a comparison between each method, and the effect size trend was confirmed. Firth, we used new diagnostic methods, including MRI-PDFF and MRE.
- In conclusion, BMI-adjusted and body weight-adjusted low muscle mass was associated with NAFLD and hepatic fibrosis. This association was consistent after adjusting for a range of variables, including socioeconomic status, health status, and risk factors. Muscle mass is thought to influence the mechanism of NAFLD development; therefore, maintaining sufficient muscle mass is important for preventing NAFLD. To identify these relationships more accurately, prospective longitudinal studies and muscle quality assessments are needed.
DISCUSSION
SUPPLEMENTAL MATERIALS
Supplemental Material 2.
Supplemental Material 3.
Supplemental Material 4.
Supplemental Material 5.
Supplemental Material 6.
-
CONFLICT OF INTEREST
The authors have no conflicts of interest associated with the material presented in this paper.
-
FUNDING
This work was supported by a National Research Foundation of Korea (NRF) grant funded by the Korean government (MSIT) (No. 2017R1A5A2015369).
Notes
ACKNOWLEDGEMENTS
-
AUTHOR CONTRIBUTIONS
Conceptualization: HJL, KSP, SBK. Data curation: HJL, JSC, KSP, MYK. Formal analysis: HJL. Funding acquisition: JSC, KSP. Methodology: HJL, SBK. Project administration: SBK. Visualization: HJL. Writing – original draft: HJL. Writing – review & editing: JSC, JHA, MYK, KSP, YSA, SBK.
Notes


Values are presented as odds ratio (95% confidence interval).
Model 1: adjusted for age and sex; Model 2: model 1+education, regular exercise, smoking and drinking; Model 3: model 2+hypertension, diabetes mellitus, and dyslipidemia.
NAFLD, non-alcoholic fatty liver disease; US, ultrasonography; MRI, magnetic resonance imaging; CNS, comprehensive NAFLD score; ASM, appendicular skeletal muscle mass; Wt, weight; BMI, body mass index; ht, height.
- 1. Chalasani N, Younossi Z, Lavine JE, Diehl AM, Brunt EM, Cusi K, et al. The diagnosis and management of non-alcoholic fatty liver disease: practice Guideline by the American Association for the Study of Liver Diseases, American College of Gastroenterology, and the American Gastroenterological Association. Hepatology 2012;55(6):2005-2023ArticlePubMed
- 2. Browning JD, Szczepaniak LS, Dobbins R, Nuremberg P, Horton JD, Cohen JC, et al. Prevalence of hepatic steatosis in an urban population in the United States: impact of ethnicity. Hepatology 2004;40(6):1387-1395ArticlePubMed
- 3. Im HJ, Ahn YC, Wang JH, Lee MM, Son CG. Systematic review on the prevalence of nonalcoholic fatty liver disease in South Korea. Clin Res Hepatol Gastroenterol 2021;45(4):101526ArticlePubMed
- 4. Delmonico MJ, Harris TB, Visser M, Park SW, Conroy MB, Velasquez-Mieyer P, et al. Longitudinal study of muscle strength, quality, and adipose tissue infiltration. Am J Clin Nutr 2009;90(6):1579-1585ArticlePubMedPMC
- 5. Shafiee G, Keshtkar A, Soltani A, Ahadi Z, Larijani B, Heshmat R. Prevalence of sarcopenia in the world: a systematic review and meta-analysis of general population studies. J Diabetes Metab Disord 2017;16: 21ArticlePubMedPMCPDF
- 6. Chen LK, Woo J, Assantachai P, Auyeung TW, Chou MY, Iijima K, et al. Asian Working Group for Sarcopenia: 2019 consensus update on sarcopenia diagnosis and treatment. J Am Med Dir Assoc 2020;21(3):300-307ArticlePubMed
- 7. Cruz-Jentoft AJ, Bahat G, Bauer J, Boirie Y, Bruyère O, Cederholm T, et al. Sarcopenia: revised European consensus on definition and diagnosis. Age Ageing 2019;48(1):16-31ArticlePubMed
- 8. Pacifico L, Perla FM, Andreoli G, Grieco R, Pierimarchi P, Chiesa C. Nonalcoholic fatty liver disease is associated with low skeletal muscle mass in overweight/obese youths. Front Pediatr 2020;8: 158ArticlePubMedPMC
- 9. Wang YM, Zhu KF, Zhou WJ, Zhang Q, Deng DF, Yang YC, et al. Sarcopenia is associated with the presence of nonalcoholic fatty liver disease in Zhejiang Province, China: a cross-sectional observational study. BMC Geriatr 2021;21(1):55ArticlePubMedPMC
- 10. Alferink LJ, Trajanoska K, Erler NS, Schoufour JD, de Knegt RJ, Ikram MA, et al. Nonalcoholic fatty liver disease in the Rotterdam study: about muscle mass, sarcopenia, fat mass, and fat distribution. J Bone Miner Res 2019;34(7):1254-1263ArticlePubMed
- 11. Sinclair M, Gow PJ, Grossmann M, Angus PW. Review article: sarcopenia in cirrhosis--aetiology, implications and potential therapeutic interventions. Aliment Pharmacol Ther 2016;43(7):765-777ArticlePubMed
- 12. Lee SW, Youm Y, Lee WJ, Choi W, Chu SH, Park YR, et al. Appendicular skeletal muscle mass and insulin resistance in an elderly Korean population: the Korean social life, health and aging project-health examination cohort. Diabetes Metab J 2015;39(1):37-45ArticlePubMedPMC
- 13. Kim G, Lee SE, Lee YB, Jun JE, Ahn J, Bae JC, et al. Relationship between relative skeletal muscle mass and nonalcoholic fatty liver disease: a 7-year longitudinal study. Hepatology 2018;68(5):1755-1768ArticlePubMed
- 14. Hong KS, Kim MC, Ahn JH. Sarcopenia Is an independent risk factor for NAFLD in COPD: a nationwide survey (KNHANES 2008-2011). Int J Chron Obstruct Pulmon Dis 2020;15: 1005-1014PubMedPMC
- 15. Peng TC, Wu LW, Chen WL, Liaw FY, Chang YW, Kao TW. Nonalcoholic fatty liver disease and sarcopenia in a Western population (NHANES III): the importance of sarcopenia definition. Clin Nutr 2019;38(1):422-428ArticlePubMed
- 16. Kim Y, Han BG; KoGES group. Cohort profile: the Korean Genome and Epidemiology Study (KoGES) consortium. Int J Epidemiol 2017;46(2):e20ArticlePubMed
- 17. Koh SB, Park JK, Yoon JH, Chang SJ, Oh SS, Kim JY, et al. Preliminary report: a serious link between adiponectin levels and metabolic syndrome in a Korean nondiabetic population. Metabolism 2010;59(3):333-337ArticlePubMed
- 18. Middleton MS, Heba ER, Hooker CA, Bashir MR, Fowler KJ, Sandrasegaran K, et al. Agreement between magnetic resonance imaging proton density fat fraction measurements and pathologist-assigned steatosis grades of liver biopsies from adults with nonalcoholic steatohepatitis. Gastroenterology 2017;153(3):753-761ArticlePubMed
- 19. Lee YH, Bang H, Park YM, Bae JC, Lee BW, Kang ES, et al. Nonlaboratory-based self-assessment screening score for non-alcoholic fatty liver disease: development, validation and comparison with other scores. PLoS One 2014;9(9):e107584ArticlePubMedPMC
- 20. Chen LK, Liu LK, Woo J, Assantachai P, Auyeung TW, Bahyah KS, et al. Sarcopenia in Asia: consensus report of the Asian Working Group for Sarcopenia. J Am Med Dir Assoc 2014;15(2):95-101ArticlePubMed
- 21. Kim YS, Lee Y, Chung YS, Lee DJ, Joo NS, Hong D, et al. Prevalence of sarcopenia and sarcopenic obesity in the Korean population based on the Fourth Korean National Health and Nutritional Examination Surveys. J Gerontol A Biol Sci Med Sci 2012;67(10):1107-1113ArticlePubMed
- 22. Studenski SA, Peters KW, Alley DE, Cawthon PM, McLean RR, Harris TB, et al. The FNIH sarcopenia project: rationale, study description, conference recommendations, and final estimates. J Gerontol A Biol Sci Med Sci 2014;69(5):547-558ArticlePubMedPMC
- 23. Altajar S, Baffy G. Skeletal muscle dysfunction in the development and progression of nonalcoholic fatty liver disease. J Clin Transl Hepatol 2020;8(4):414-423ArticlePubMedPMC
- 24. Kaser S, Moschen A, Cayon A, Kaser A, Crespo J, Pons-Romero F, et al. Adiponectin and its receptors in non-alcoholic steatohepatitis. Gut 2005;54(1):117-121ArticlePubMedPMC
- 25. Aleffi S, Petrai I, Bertolani C, Parola M, Colombatto S, Novo E, et al. Upregulation of proinflammatory and proangiogenic cytokines by leptin in human hepatic stellate cells. Hepatology 2005;42(6):1339-1348ArticlePubMed
- 26. Pedersen BK, Febbraio MA. Muscles, exercise and obesity: skeletal muscle as a secretory organ. Nat Rev Endocrinol 2012;8(8):457-465ArticlePubMed
- 27. Batsis JA, Villareal DT. Sarcopenic obesity in older adults: aetiology, epidemiology and treatment strategies. Nat Rev Endocrinol 2018;14(9):513-537ArticlePubMedPMC
- 28. Hamrick MW, McGee-Lawrence ME, Frechette DM. Fatty infiltration of skeletal muscle: mechanisms and comparisons with bone marrow adiposity. Front Endocrinol (Lausanne) 2016;7: 69ArticlePubMedPMC
- 29. Lim S, Kim JH, Yoon JW, Kang SM, Choi SH, Park YJ, et al. Sarcopenic obesity: prevalence and association with metabolic syndrome in the Korean Longitudinal Study on Health and Aging (KLoSHA). Diabetes Care 2010;33(7):1652-1654ArticlePubMedPMC
- 30. Caussy C, Reeder SB, Sirlin CB, Loomba R. Noninvasive, quantitative assessment of liver fat by MRI-PDFF as an endpoint in NASH trials. Hepatology 2018;68(2):763-772ArticlePubMed
- 31. Yodoshi T, Orkin S, Arce Clachar AC, Bramlage K, Sun Q, Fei L, et al. Muscle mass is linked to liver disease severity in pediatric nonalcoholic fatty liver disease. J Pediatr 2020;223: 93-99ArticlePubMedPMC
- 32. Linge J, Ekstedt M, Dahlqvist Leinhard O. Adverse muscle composition is linked to poor functional performance and metabolic comorbidities in NAFLD. JHEP Rep 2020;3(1):100197ArticlePubMedPMC
REFERENCES
Figure & Data
References
Citations
- Prevalence of Sarcopenia and Its Defining Components in Non-alcoholic Fatty Liver Disease Varies According to the Method of Assessment and Adjustment: Findings from the UK Biobank
Christine L. Freer, Elena S. George, Sze-Yen Tan, Gavin Abbott, David Scott, Robin M. Daly
Calcified Tissue International.2024; 114(6): 592. CrossRef - Prevalence and outcome of sarcopenia in non-alcoholic fatty liver disease
Suprabhat Giri, Prajna Anirvan, Sumaswi Angadi, Ankita Singh, Anurag Lavekar
World Journal of Gastrointestinal Pathophysiology.2024;[Epub] CrossRef - Association between Regional Body Muscle Mass and Non-Alcoholic Fatty Liver Disease: An Observational Study Using Data from the REACTION Study
Jing Du, Shizhan Ma, Li Fang, Meng Zhao, Zhongshang Yuan, Yiping Cheng, Jiajun Zhao, Xiude Fan, Qingling Guo, Zhongming Wu
Journal of Personalized Medicine.2023; 13(2): 209. CrossRef - Predicting Habitual Use of Wearable Health Devices Among Middle-aged Individuals With Metabolic Syndrome Risk Factors in South Korea: Cross-sectional Study
Jaeyoung Ha, Jungmi Park, Sangyi Lee, Jeong Lee, Jin-Young Choi, Junhyoung Kim, Sung-il Cho, Gyeong-Suk Jeon
JMIR Formative Research.2023; 7: e42087. CrossRef - Osteosarcopenia in NAFLD/MAFLD: An Underappreciated Clinical Problem in Chronic Liver Disease
Alessandra Musio, Federica Perazza, Laura Leoni, Bernardo Stefanini, Elton Dajti, Renata Menozzi, Maria Letizia Petroni, Antonio Colecchia, Federico Ravaioli
International Journal of Molecular Sciences.2023; 24(8): 7517. CrossRef
 PubReader
 ePub Link
 Cite
Cite