ABSTRACT
-
Objectives
- This study assessed the validity and reliability of the Health-related Quality of Life Instrument with 8 Items (HINT-8) in patients with diabetes. HINT-8 is a newly-developed, generic health-related quality of life (HRQoL) instrument.
-
Methods
- Three HRQoL instruments—HINT-8, EuroQoL 5-Dimension 5-Level (EQ-5D-5L), and Short Form Health Survey version 2.0 (SF-36v2)—were provided to 300 patients with diabetes visiting a tertiary hospital for follow-up visits in Korea. The HRQoL scores obtained using the HINT-8 were evaluated for subgroups with known differences based on demographics and diabetes-related characteristics (known-group validity). The mean scores of the instruments were compared between groups segmented by their responses to the HINT-8 (discriminatory ability). Correlation coefficients of the HINT-8 with other instruments were calculated (convergent and divergent validity). The Cohen kappa and intra-class correlation coefficient (ICC) were also evaluated (test-retest reliability).
-
Results
- The average HINT-8 indexes were lower among women, older, and less-educated subjects. Subjects who did not list any problems on the HINT-8 had significantly higher HRQoL scores than those who did. The correlation coefficients of the HINT-8 with the EQ-5D-5L index and EuroQoL visual analogue scale were 0.715 (p<0.001) and 0.517 (p<0.001), respectively. The correlation coefficients between the HINT-8 index and the scores of 8 domains of the SF-36v2 ranged from 0.478 (p<0.001) to 0.669 (p<0.001). The Cohen kappa values for the HINT-8 ranged from 0.268 to 0.601, and the ICC of the HINT-8 index was 0.800 (95% confidence interval [CI], 0.720 to 0.860).
-
Conclusions
- This study showed that the HINT-8 is a valid and reliable HRQoL instrument for patients with diabetes.
-
Keywords: Diabetes mellitus, Type 2, EQ-5D-5L, HINT-8, Quality of life, Reproducibility of results
INTRODUCTION
- In 2017, the prevalence of diabetes worldwide was estimated to be 8.8% (415 million people), and it was projected to increase to 9.9% (629 million people) by 2045 [1]. All-cause mortality attributed to diabetes decreased over the last 2 decades [2]; however, the number of deaths has remained considerable, at about 5.0 million in 2017, comprising about 9.9% of total global deaths in those over the age of 20 [1]. To overcome the substantial disease burden attributed to diabetes, patients require consistent medical attention to prevent microvascular or macrovascular complications [3]. In 2014, 4.8 million people (13.7%) of those over the age of 30 in Korea were estimated to have diabetes [4]. An increase in the age-standardized prevalence of type 2 diabetes mellitus (T2DM) was also observed in men and women (from 9.9 to 11.4% and from 7.9 to 8.7%, respectively) from 2005 to 2015 [5]. Standardized all-cause mortality rates for patients with diabetes decreased from 14.53 to 9.39 per 1000 persons between 2003 and 2013 in Korea [6], and diabetes has been the leading cause of disease burden in Korea [7]. These epidemiological data related to diabetes suggest a critical role of health-related quality of life (HRQoL) in the care of patients with diabetes.
- As trade-offs between length of life and quality of life have increasingly been an issue in healthcare, HRQoL is currently considered an important tool to overcome the limitations of classic epidemiological measures such as mortality [7]. HRQoL can be lowered by various chronic diseases that result in healthcare costs. HRQoL is therefore used not only to measure the impact of diseases, but also the effects of medical interventions [8]. In Korean guidelines for the economic evaluation of pharmaceuticals, the use of quality-adjusted life-years derived from an HRQoL instrument is recommended for cost-utility analysis [9]. The current longer average duration of diabetes, which is attributable to both increasing prevalence and decreasing mortality, increases the importance of HRQoL during the extended lifetime of patients with diabetes.
- The EuroQoL 5-Dimension 3-Level (EQ-5D-3L) was introduced to measure generic health status by the EuroQol Group in 1990, and is widely used all over the world. The EuroQoL 5-Dimension 5-Level (EQ-5D-5L) was developed to cover a wider range of health states by increasing the number of response levels to 5 levels from the 3 levels in the EQ-5D-3L [10]. In Korea, both the EQ-5D-3L and EQ-5D-5L have been shown to be both valid and reliable in the general population and in those with chronic diseases such as diabetes [11–17]. Country-specific value sets for both the 3-level and 5-level versions of EuroQoL 5-Dimension (EQ-5D) are broadly used in Korea [13,18]. The use of these tools has shown potential cultural differences in HRQoL, with problem-reporting rates in Korea being lower than those of other countries using EQ-5D measurements [19]. Differences in HRQoL between Korean and Western populations were also observed in studies using the Short Form Health Survey version 2.0 (SF-36v2) [20]. In response to these concerns, the Health-related Quality of Life Instrument with 8 Items (HINT-8) was developed, and its validity and reliability were confirmed in the general population [21,22]. The current study evaluated the validity and reliability of the HINT-8 among individuals with a common chronic disease, T2DM.
METHODS
- Subjects and Study Setting
- A consecutive series of 300 T2DM patients age 20 or older were recruited for this study while visiting an outpatient clinic of a tertiary hospital in Seoul, Korea, between February and April 2018. Participants were provided informed written consent and then completed paper-based surveys to measure HRQoL. The study participants were assisted by a registered nurse trained as a research interviewer. To determine test-retest reliability, telephone-based interviews were conducted about 1–4 weeks after the initial survey with 100 consecutive participants who consented to a follow-up survey administered by the same interviewer.
- Measurement
- Demographic and socioeconomic characteristics (gender, age, educational level, marital status, monthly household income, outpatient visit, hospitalization, and self-rated health) and clinical information (duration of disease, current treatments, and comorbidities) were obtained from all participants using structured questionnaires. While all 3 HRQoL instruments (HINT-8, EQ-5D-5L, and SF-36v2) were administered to all participants in the initial test, only the HINT-8 and EQ-5D-5L were used to test reliability in the second-round survey. Due to the limitations of telephone-based surveys, the EuroQoL visual analogue scale (EQ-VAS) was not included in the follow-up. We used the SF-36v2 (QualityMetric Inc., Lincoln, RI, USA) because disease-specific HRQoL instruments targeting patients with diabetes with confirmed validity in the Korean population had not been found when designing the study [23,24]. The validity of the SF-36v2 has been confirmed not only for the general population, but also for patients with diabetes [20,25].
- The HINT-8 is a generic HRQoL instrument consisting of 8 items (climbing stairs, pain, vitality, working, depression, memory, sleep, and happiness) and 4 levels (no, mild, moderate, and severe problems), yielding a total of 65 536 (48) health states [21,26]. A Korean-specific tariff of the HINT-8 was developed, with the range being 0.132 (worst possible health state, 44444444) and 1.000 (best possible health state, 11111111) [26]. The EQ-5D-5L, a widely used generic HRQoL instrument, comprises 5 dimensions (mobility, self-care, usual activities, pain/discomfort, and anxiety) and 5 levels (no, slight, moderate, severe, and extreme problems) [27]. The EQ-5D-5L ranges from -0.066 (55555) to 1.000 (11111), when using a utility formula developed in the Korean valuation study [13]. The Optum® PRO CoRE software was used to produce 8 domains and 2 norm-based scores (physical and mental component summary) from the 36 questions of the SF-36v2 [28]. The Short Form 6-Dimension (SF-6D) profiles (physical function, role limitation, social functioning, pain, mental health, and vitality) and preference-based utility indexes were derived from the SF-36v2 profiles [29,30]. The SF-6D index ranged from 0.3 to 1.0. To identify a positive skew distribution of the response, ceiling effects were evaluated by comparing the best possible health state [31].
- Validity and Reliability
- To determine discriminatory ability, the mean scores of the HRQoL instruments—the EQ-5D-5L index, EQ-VAS, SF-36v2 domain score, and SF-6D index—were compared between two groups based on their HINT-8 responses. One group was defined as having “no problems” (level=1), and the others as having “problems” (mild, moderate, or severe problems, level= 2, 3, or 4). The hypothesis was that there might be significant differences between the problem reporting subgroups in the HINT-8 [22]. For known-group validity, the ability of HINT-8 to discriminate between groups based on socio-demographic and diabetes-related features was assessed. For general characteristics, women, older, and less-educated participants were expected to have lower HRQoL scores than other participants [22]. For diabetes-related characteristics, participants with comorbidities other than T2DM, longer diabetes duration, and current use of insulin therapy were expected to have lower HRQoL scores. For convergent validity, correlations between HINT-8 items and related areas of the other HRQoL instruments were evaluated using Spearman correlation coefficients, and the relationship between the HINT-8 index and the continuous index measures of other HRQoL instruments (EQ-5D-5L, EQ-VAS, and SF-6D) was identified with Pearson correlation coefficients. Individual HINT-8 items were expected to be highly correlated with related dimensions of the EQ-5D-5L, domain scores of the SF-36v2, and domain scores of the SF-6D. For example, it was expected that the pain item of the HINT-8 would correlate more strongly with the pain domain than the others of the SF-36v2. For the HINT-8 index, a strong correlation was expected with utility indexes of the EQ-5D-5L and the SF-6D. For divergent validity, the correlation coefficients among irrelevant items (e.g., the correlation coefficient between climbing stairs of HINT-8 and anxiety/depression of EQ-5D-5L) were expected to be relatively low.
- The test-retest reliability was assessed using the Cohen kappa and weighted kappa to quantify the extent of agreement for each dimension over what was expected [32]. The intraclass correlation coefficient (ICC) was used to assess the reliability of the HINT-8 index [33]. Statistical analysis was carried out using SAS version 9.4 (SAS Institute Inc., Cary, NC, USA). A p-value less than 0.05 indicated statistical significance.
- Ethics Statement
- The Institutional Review Board of Asan Medical Center approved the study (IRB approval No. 2018-0027).
RESULTS
- Subjects
- Men respondents comprised 65.7% (n=197) and 67.0% (n=67) of all participants in the first and follow-up surveys, respectively (Table 1). Of the 300 participants who completed the initial tests, 100 consecutive respondents participated in the second test by telephone. The mean ages of the patients in the first and the second surveys were 60.4 and 60.7 years, respectively. The breakdown of the initial and follow-up surveys by educational level was as follows: less than primary school (11.0 and 15.0%, respectively), intermediate school (11.3 and 10.0%), secondary school (36.3 and 35.0%), and university degree or higher (41.3 and 40.0%). The average household monthly income was US$4565 in the first survey and US$4260 in the follow-up. The average durations of diabetes were 8.4 years in the first survey and 9.5 years in the follow-up. A total of 23.0% (first survey, n=69) and 33.0% (second survey, n=33) of patients received insulin therapy. The percentage of patients with comorbidities other than T2DM was 66.3% (n= 199) in the first test and 70.0% (n=70) in the follow-up.
- Distribution of Responses and Ceiling Effects
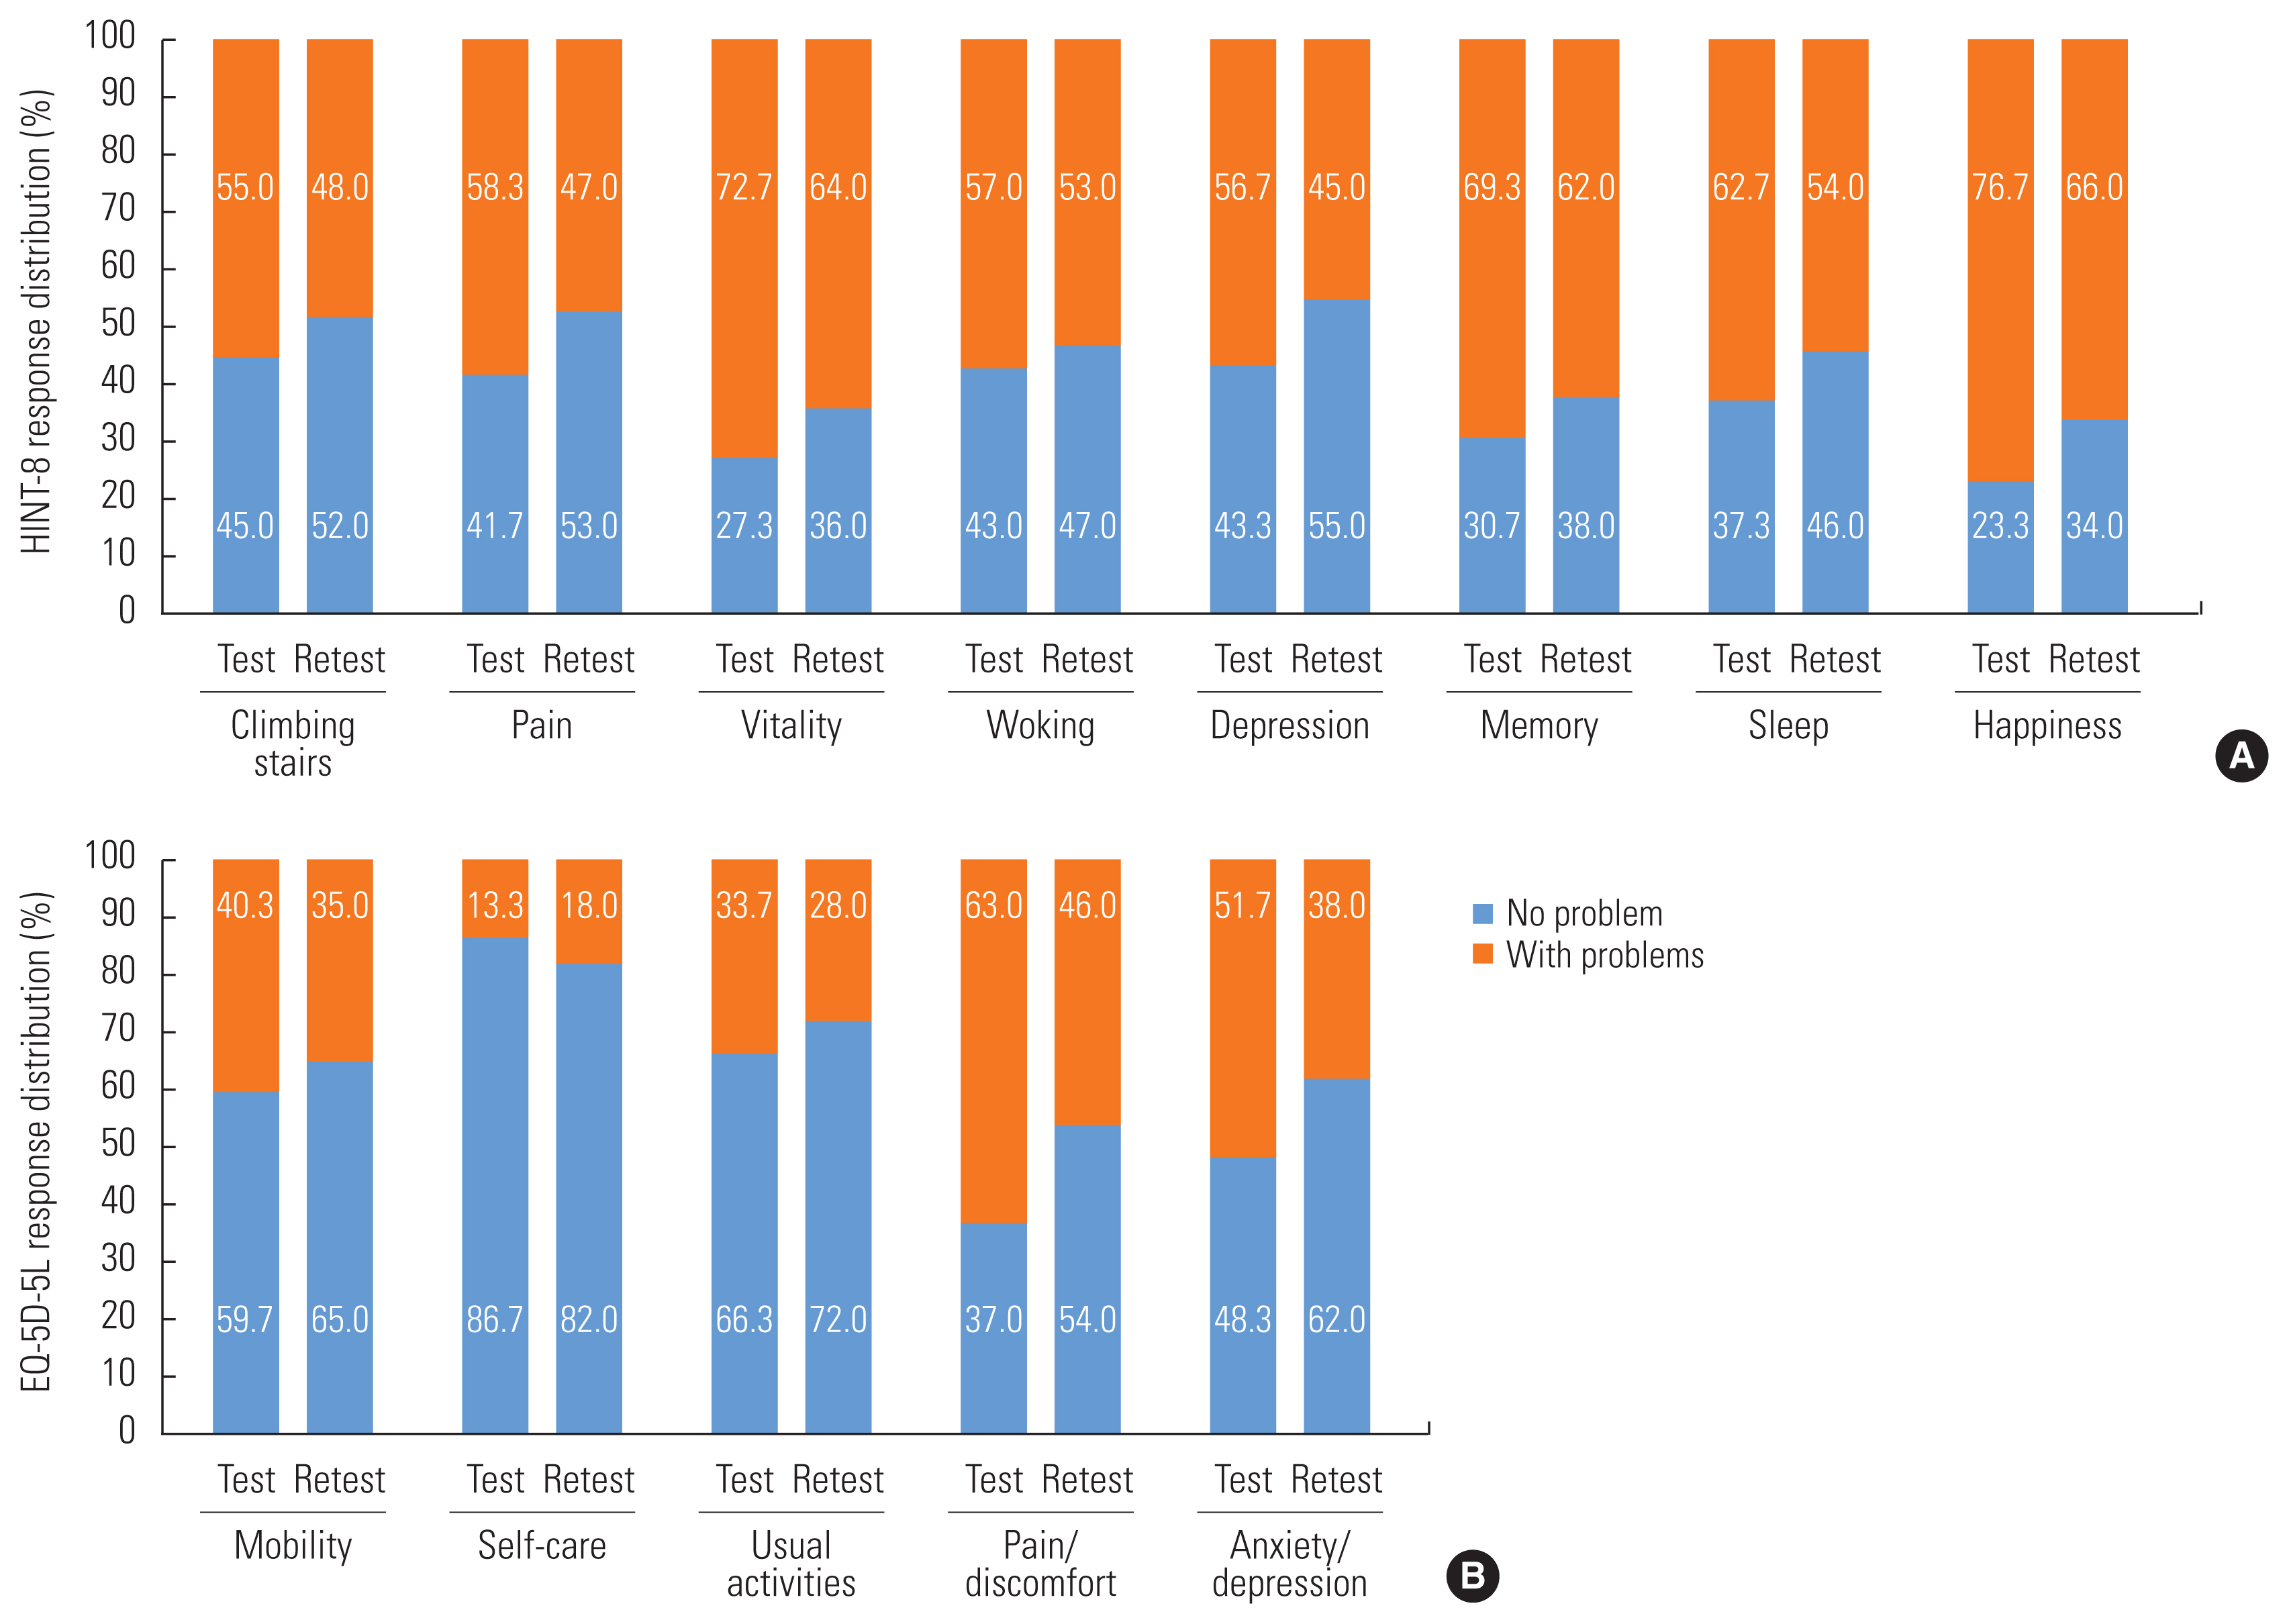
- The HINT-8 happiness item had the highest proportion of reporting problems in both surveys: 76.7% in the first test and 66.0% in the follow-up test (Figure 1A). In the response distribution of the EQ-5D-5L, the pain/discomfort domain showed the highest percentage of problems in both surveys (first survey, 63.0%; second survey, 46.0%) (Figure 1B). In the first survey, the mean±standard deviations (SD) of the HINT-8 index, EQ-5D-5L index, and EQ-VAS were 0.794±0.111, 0.826±0.134, and 73.2±16.4, respectively. In the follow-up test, the mean±SD of the HINT-8 index and EQ-5D-5L index were 0.812±0.121 and 0.858±0.136, respectively. For the SF-36v2, average T-scores for individual domains were between 43.0±9.7 on the general health and 50.9±9.9 on the bodily pain, while the component scores for physical and mental health were 47.4±7.9 and 48.4±10.7, respectively. The mean±SD of the SF-6D index among the respondents was 0.720±0.135.
- Comparisons of the individual HRQoL instruments of the proportions of full health (reporting no problems in all dimensions or items) are presented in Supplemental Material 1. While 14 respondents (4.7%) reported the best possible health state (11111111) in the HINT-8, 69 participants (23.0%) described their health as perfect (11111) in the EQ-5D-5L. Only 7 cases (2.3%) of reported perfect health were identified in the SF-6D. Those who reported perfect health in the HINT-8 showed higher scores in the domains and composite scores of the SF-36v2 than those who reported perfect health in the EQ-5D-5L.
- Validity and Reliability
-
Table 2 presents comparisons between the groups with and without problems for each item of the HINT-8 with other HRQoL instruments (EQ-5D-5L, EQ-VAS, and SF-6D). The respondents describing themselves as having problems in the HINT-8 showed significantly lower index scores in EQ-5D-5L, EQ-VAS, and SF-6D, which indicates poorer health states than respondents who described themselves as without problems. The differences in the EQ-5D-5L indexes between problem reporting groups of the HINT-8 depended on the items. The difference was highest (0.140) for the pain item, and lowest for the sleep item (0.080). On the EQ-VAS, the difference was highest for the vitality item (14.5) and lowest for the memory item (5.0) of the HINT-8. On the SF-6D index, the difference was highest for the working item (0.154) of the HINT-8 and lowest for the memory item (0.104). Comparing individual HINT-8 item responses to the SF-36v2 scores, for each item, participants reporting problems on the HINT-8 showed higher scores compared to subjects reporting no problems (Supplemental Material 2).
- HINT-8 indexes are shown in Supplemental Material 3 by general and clinical characteristics. Women, older, and lower-educated respondents showed lower HINT-8 indexes than the other groups. For comorbidities other than T2DM, the difference in the HINT-8 indexes did not show statistical significance (p= 0.730). For current treatment, the insulin therapy group showed significantly lower HINT-8 indexes (0.740 vs. 0.810; p<0.05).
- The correlations between each item of HINT-8, the HINT-8 index, dimensions of EQ-5D-5L, EQ-5D-5L indexes and EQ-VAS are presented in Table 3. While the climbing stairs item of the HINT-8 showed a strong correlation with the mobility dimension of the EQ-5D-5L (r=0.509), it showed a relatively low correlation with anxiety/depression (r=0.279). The pain item of the HINT-8 had the highest correlation with the pain/discomfort dimension of the EQ-5D-5L (r=0.602). The working item of the HINT-8 had a relatively strong correlation with the usual activities dimension of the EQ-5D-5L (r=0.512). The depression item of the HINT-8 showed the strongest correlation with the anxiety/depression dimension of the EQ-5D-5L (r=0.659), but it had low correlations with the mobility and self-care dimensions of the EQ-5D-5L (r=0.245 and 0.152, respectively). The correlations between the HINT-8 memory item and EQ-5D-5L dimensions were lower than for other items, ranging from r=0.178 to r=0.293. The correlations between the HINT-8 sleep item and the dimensions of the EQ-5D-5L, similarly ranged from r=0.153 to r=0.347. Supplemental Material 4 shows the correlation coefficients between HINT-8 items and SF-36v2 T-scores. The climbing stairs item of the HINT-8 showed strong correlations with physical function and physical component summary scores of the SF-36v2 (r=-0.655 and -0.619, respectively), while the HINT-8 pain item had strong correlation with the SF-36v2 bodily pain and physical component summary scores (r=-0.632 and −0.562, respectively). The HINT-8 depression item showed strong correlations with vitality and mental health (r=−0.531 and −0.601, respectively), as well as the mental component summary scores of the SF-36v2 (r=−0.576). The Pearson correlation coefficient of the HINT-8 and SF-6D indexes was 0.724.
- For reliability, Table 4 shows that the percent agreement of the HINT-8 between surveys varied from 50.0% to 78.0% across items. Cohen kappa values were between 0.268 and 0.601 for individual items of the HINT-8, which shows fair to substantial agreement [34,35]. Weighted kappa statistics for the HINT-8 ranged from 0.342 (happiness) to 0.634 (depression), and most items showed moderate to substantial agreement according to Landis and Koch [35]. The ICC of the HINT-8 indexes between the first and the follow-up study was 0.800, and the confidence intervals for the ICC did not contain 0 (95% CI, 0.720 to 0.860), indicating significance.
DISCUSSION
- This study evaluated the validity and reliability of the HINT-8 in Korean patients with T2DM. Overall, our findings showed good performance of the HINT-8 for discriminatory ability, known-group validity, convergent validity, and reliability. A lower proportion of respondents reported a full health state in the HINT-8 compared to the EQ-5D-5L (4.7 vs. 23.0%). The proportion of the perfect health state of the EQ-5D-5L was similar to previous studies with diabetes patients conducted in Denmark and England (28.3%), and was better than the EQ-5D-3L result (33.9%) in the same study [36,37]. Given this lower proportion of full health state reporting, the HINT-8 appears to have a better ability to distinguish mild health states than the EQ-5D-5L.
- The HINT-8 indexes for women, older, and less-educated respondents were lower than those for their counterparts, which validated the hypothesis related to known-group validity. These results correspond with the findings of Lee et al. [11], which evaluated the quality of life in diabetes patients using the EQ-5D-3L. The patients who received insulin therapy had lower HINT-8 indexes than those who did not; this finding is similar to the results of Mulhern and Meadows [38], in which the insulin therapy group had poorer HRQoL as measured by the EQ-5D-3L, SF-6D, and Diabetes Health Profile-18 than the group on a diet and tablets regimen. Participants with comorbidities showed higher HINT-8 indexes than those who did not have comorbidities, but the difference was subtle and not statistically significant. For comorbidities, determining the difference in the HRQoL will need a study with a larger sample size. Such a study would also need to consider key features of comorbidities such as numbers and types to identify the true impact of comorbidity on HRQoL. There were also significant differences in HRQoL among disease duration subgroups, which was similar to the findings of previous studies by Mulhern and Meadows [38] and Kiadaliri et al. [39], who defined long-term disease duration as over 5 years and over 8 years, respectively.
- Our results support the hypothesis of this study regarding the relationship between individual items of the HINT-8 and other related HRQoL instrument areas. The climbing stairs item of the HINT-8 was strongly correlated with the mobility dimension of the EQ-5D-5L, the physical function domain score and physical component summary scores of the SF-36v2, and the physical function domain scores of the SF-6D. The pain item of the HINT-8 was strongly correlated with the pain/discomfort dimension of the EQ-5D-5L, the bodily pain domain and physical component summary scores of the SF-36v2, and the pain domain of the SF-6D. The depression item of the HINT-8 was strongly correlated with the anxiety/depression dimension of the EQ-5D-5L, the mental health domain of the SF-36v2, and the SF-6D index. The memory item of the HINT-8 showed a relatively lower correlation with most subareas of the other HRQoL instruments, but this is likely because the memory item is a unique area of the HINT-8 not included in the EQ-5D-5L or SF-36v2 [21].
- Most weighted kappa statistics showed moderate to substantial agreement (range, 0.342 to 0.634), while Cohen kappa values showed fair to substantial agreement (range, 0.268 to 0.601). This result is consistent with previous findings from the EQ-5D-3L validity study using different survey methods between the initial and follow-up test (kappa values range, 0.206 to 0.446) [40]. The kappa value of the happiness item was the lowest—as in the prior study—and the ICC of the HINT-8 index was also similar to previous outcomes [22]. Different survey administration methods between test and retest might have contributed to lower kappa statistics than reported in previous studies.
- This study had several limitations. The first potential limitation is that the study was conducted at a tertiary care hospital, which might limit the ability to generalize the results. However, our study participants did have age and sex distributions similar to recent reports on the prevalence of diabetes (age <49: 20.0%; 50–69: 51.8%; ≥70: 28.1%; men, 53.6%) [4]. Therefore, the results of this study should be interpreted as applicable to diabetes patients in Korea and several other Asian countries with similar cultures. The second potential limitation is using a different survey method (i.e., telephone surveys), which limited the utilization of the EQ-VAS data, in the follow-up tests. Although the same interviewer administered initial and follow-up surveys to minimize bias, different survey methods might have affected reliability. The last potential limitation is the use of a general HRQoL instrument for the comparison instead of a condition-specific HRQoL for diabetes. At the time the study was designed, a relevant disease-specific HRQoL instrument for diabetes had not been validated in Korea [23]. In addition, the SF-36v2 is a widely used HRQoL instrument for patients with diabetes and its validity has been confirmed [23,25]. This choice, however, might have limited the use of data on more specific diabetic conditions. In the future, studies on the psychometric properties of the HINT-8 should use not only commonly used generic HRQoL instruments, but also condition-specific HRQoL instruments for patients with diabetes.
- In conclusion, this study showed that the HINT-8 is a valid and reliable HRQoL instrument for patients with T2DM. The results also showed some superior measurement properties compared to commonly used HRQoL instruments (i.e., EQ-5D-5L), as indicated by reduced ceiling effects. Our findings support using this newly developed HRQoL tool, the HINT-8, to measure HRQoL in patients with T2DM.
SUPPLEMENTAL MATERIALS
Supplemental materials are available at https://doi.org/10.3961/jpmph.22.020.
ACKNOWLEDGEMENTS
The authors would like to thank Sun Kim for her help with data collection.
Notes
-
CONFLICT OF INTEREST
The authors have no conflicts of interest associated with the material presented in this paper.
-
FUNDING
This research was supported by Basic Science Research Program through the National Research Foundation of Korea (NRF) funded by the Ministry of Education (NRF-2015R1D1A1A010-59426).
-
AUTHOR CONTRIBUTIONS
Conceptualization: Jo MW, Lee HJ. Data curation: Kim J. Formal analysis: Kim J. Funding acquisition: Jo MW. Methodology: Jo MW, Lee HJ. Project administration: Lee HJ. Kim J. Visualization: Kim J. Writing – original draft: Kim J. Writing – review & editing: Jo MW, Lee HJ. Kim J.
Figure 1Response distribution of health-related quality of life instruments (A) HINT-8. (B) EQ-5D-5L. HINT-8, Health-related Quality of Life Instrument with 8 Items; EQ-5D-5L, EuroQoL 5-Dimension 5-Level.

Table 1General and clinical characteristics
|
Characteristics |
Baseline (n=300) |
Follow-up (n=100) |
|
Gender |
|
Men |
197 (65.7) |
67 (67.0) |
|
Women |
103 (34.3) |
33 (33.0) |
|
|
Age (y) |
60.4±11.6 |
60.7±12.2 |
|
≤49 |
51 (17.0) |
21 (21.0) |
|
50–69 |
178 (59.3) |
52 (52.0) |
|
≤70 |
71 (23.7) |
27 (27.0) |
|
|
Level of education |
|
Less than primary school |
33 (11.0) |
15 (15.0) |
|
Intermediate school |
34 (11.3) |
10 (10.0) |
|
Secondary school |
109 (36.3) |
35 (35.0) |
|
University degree or higher |
124 (41.3) |
40 (40.0) |
|
|
Marital status |
|
Married |
248 (82.7) |
78 (78.0) |
|
Others |
52 (17.3) |
22 (22.0) |
|
|
Household monthly income (US$) |
4565±7645 |
4260±6134 |
|
Q1 (<1425) |
663±428 |
712±393 |
|
Q2 (1425–3023) |
2413±408 |
2707±412 |
|
Q3 (3023–5484) |
4041±570 |
3797±472 |
|
Q4 (≥5484) |
11 511±12 953 |
10 174±8840 |
|
|
Outpatient visit in the past 2 wk |
|
Yes |
92 (30.7) |
32 (32.0) |
|
No |
208 (69.3) |
68 (68.0) |
|
|
Hospitalization in the past 1 y |
|
Yes |
84 (28.0) |
37 (37.0) |
|
No |
216 (72.0) |
63 (63.0) |
|
|
Self-rated health |
|
Very good/Good |
48 (16.0) |
14 (14.0) |
|
Moderate/Poor/Very poor |
252 (84.0) |
86 (86.0) |
|
|
Duration of disease since diagnosis (y)1
|
8.4±9.0 |
9.5±10.2 |
|
Q1 (<1.3) |
0.3±0.4 |
0.1±0.2 |
|
Q2 (1.3–4.9) |
3.2±1.2 |
3.4±2.1 |
|
Q3 (5.0–11.4) |
9.0±1.6 |
11.1±2.1 |
|
Q4 (≥11.5) |
21.3±7.7 |
24.9±7.8 |
|
|
Current treatment |
|
Insulin therapy |
69 (23.0) |
33 (33.0) |
|
Others |
231 (77.0) |
67 (67.0) |
|
|
Comorbidities |
|
Yes |
199 (66.3) |
70 (70.0) |
|
No |
101 (33.7) |
30 (30.0) |
Table 2EQ-5D-5L, EQ-VAS, and SF-6D indexes by HINT-8 items and levels
|
HINT-8 item |
Problem reporting1
|
n (%) |
EQ-5D-5L index |
EQ-VAS |
SF-6D index |
|
Climbing stairs |
No problems |
135 (45.0) |
0.892***
|
78.7*
|
0.790***
|
|
With problems |
165 (55.0) |
0.772 |
68.8 |
0.663 |
|
|
Pain |
No problems |
125 (41.7) |
0.908***
|
78.9*
|
0.788***
|
|
With problems |
175 (58.3) |
0.768 |
69.2 |
0.671 |
|
|
Vitality |
No problems |
82 (27.3) |
0.912***
|
83.8*
|
0.827***
|
|
With problems |
218 (72.7) |
0.794 |
69.3 |
0.680 |
|
|
Working |
No problems |
129 (43.0) |
0.903***
|
81.2*
|
0.808***
|
|
With problems |
171 (57.0) |
0.768 |
67.3 |
0.654 |
|
|
Depression |
No problems |
130 (43.3) |
0.895***
|
80.2*
|
0.799***
|
|
With problems |
170 (56.7) |
0.773 |
67.9 |
0.660 |
|
|
Memory |
No problems |
92 (30.7) |
0.886***
|
76.7*
|
0.792***
|
|
With problems |
208 (69.3) |
0.799 |
71.7 |
0.688 |
|
|
Sleep |
No problems |
112 (37.3) |
0.876***
|
77.4*
|
0.788***
|
|
With problems |
188 (62.7) |
0.796 |
70.7 |
0.679 |
|
|
Happiness |
No problems |
70 (23.3) |
0.900***
|
81.7*
|
0.826***
|
|
With problems |
230 (76.7) |
0.803 |
70.6 |
0.688 |
Table 3Correlation coefficients between HINT-8 and EQ-5D-5L
Table 4Test-retest reliability of the HINT-8
|
Factors |
Cohen kappa (95% CI) |
Weighted kappa (95% CI) |
Agreement (%) |
|
Climbing stairs |
0.497 (0.353, 0.641) |
0.572 (0.437, 0.707) |
70.0 |
|
Pain |
0.494 (0.352, 0.637) |
0.530 (0.396, 0.663) |
70.0 |
|
Vitality |
0.337 (0.199, 0.474) |
0.439 (0.300, 0.578) |
54.0 |
|
Working |
0.524 (0.385, 0.664) |
0.565 (0.429, 0.701) |
71.0 |
|
Depression |
0.601 (0.458, 0.745) |
0.634 (0.491, 0.778) |
78.0 |
|
Memory |
0.424 (0.260, 0.587) |
0.486 (0.329, 0.643) |
69.0 |
|
Sleep |
0.389 (0.241, 0.537) |
0.466 (0.323, 0.610) |
62.0 |
|
Happiness |
0.268 (0.128, 0.408) |
0.342 (0.199, 0.485) |
50.0 |
|
HINT-8 index, ICC (95% CI) |
0.800 (0.720, 0.860) |
|
REFERENCES
- 1. Cho NH, Shaw JE, Karuranga S, Huang Y, da Rocha Fernandes JD, Ohlrogge AW, et al. IDF Diabetes Atlas: global estimates of diabetes prevalence for 2017 and projections for 2045. Diabetes Res Clin Pract 2018;138: 271-281ArticlePubMed
- 2. Harding JL, Pavkov ME, Magliano DJ, Shaw JE, Gregg EW. Global trends in diabetes complications: a review of current evidence. Diabetologia 2019;62(1):3-16ArticlePubMedPDF
- 3. Forssas E, Arffman M, Manderbacka K, Keskimäki I, Ruuth I, Sund R. Multiple complications among people with diabetes from Finland: an 18-year follow-up in 1994–2011. BMJ Open Diabetes Res Care 2016;4(1):e000254ArticlePubMedPMC
- 4. Won JC, Lee JH, Kim JH, Kang ES, Won KC, Kim DJ, et al. Diabetes fact sheet in korea, 2016: an appraisal of current status. Diabetes Metab J 2018;42(5):415-424ArticlePubMedPMCPDF
- 5. Lee JW, Kang HT, Lim HJ, Park B. Trends in diabetes prevalence among Korean adults based on Korean National Health and Nutrition Examination Surveys III–VI. Diabetes Res Clin Pract 2018;138: 57-65ArticlePubMed
- 6. Kim KJ, Kwon TY, Yu S, Seo JA, Kim NH, Choi KM, et al. Ten-year mortality trends for adults with and without diabetes mellitus in South Korea, 2003 to 2013. Diabetes Metab J 2018;42(5):394-401ArticlePubMedPMCPDF
- 7. Karimi M, Brazier J. Health, health-related quality of life, and quality of life: what is the difference? Pharmacoeconomics 2016;34(7):645-649ArticlePubMedPDF
- 8. Megari K. Quality of life in chronic disease patients. Health Psychol Res 2013;1(3):e27ArticlePubMedPMCPDF
- 9. Health Insurance Review and Assessment Service. Guidelines for economic evaluation of pharmaceuticals. 2nd ed. Wonju: Health Insurance Review and Assessment Service; 2011. p. 10 (Korean)
- 10. Janssen MF, Birnie E, Haagsma JA, Bonsel GJ. Comparing the standard EQ-5D three-level system with a five-level version. Value Health 2008;11(2):275-284ArticlePubMed
- 11. Lee WJ, Song KH, Noh JH, Choi YJ, Jo MW. Health-related quality of life using the EuroQol 5D questionnaire in Korean patients with type 2 diabetes. J Korean Med Sci 2012;27(3):255-260ArticlePubMedPMCPDF
- 12. Kim SH, Jo MW, Lee JW, Lee HJ, Kim JK. Validity and reliability of EQ-5D-3L for breast cancer patients in Korea. Health Qual Life Outcomes 2015;13: 203ArticlePubMedPMC
- 13. Kim SH, Ahn J, Ock M, Shin S, Park J, Luo N, et al. The EQ-5D-5L valuation study in Korea. Qual Life Res 2016;25(7):1845-1852ArticlePubMedPDF
- 14. Kim SH, Hwang JS, Kim TW, Hong YS, Jo MW. Validity and reliability of the EQ-5D for cancer patients in Korea. Support Care Cancer 2012;20(12):3155-3160ArticlePubMedPDF
- 15. Kim SH, Kim HJ, Lee SI, Jo MW. Comparing the psychometric properties of the EQ-5D-3L and EQ-5D-5L in cancer patients in Korea. Qual Life Res 2012;21(6):1065-1073ArticlePubMedPDF
- 16. Kim SK, Kim SH, Jo MW, Lee SI. Estimation of minimally important differences in the EQ-5D and SF-6D indices and their utility in stroke. Health Qual Life Outcomes 2015;13: 32ArticlePubMedPMCPDF
- 17. Kim TH, Jo MW, Lee SI, Kim SH, Chung SM. Psychometric properties of the EQ-5D-5L in the general population of South Korea. Qual Life Res 2013;22(8):2245-2253ArticlePubMedPDF
- 18. Lee YK, Nam HS, Chuang LH, Kim KY, Yang HK, Kwon IS, et al. South Korean time trade-off values for EQ-5D health states: modeling with observed values for 101 health states. Value Health 2009;12(8):1187-1193ArticlePubMed
- 19. Ock M, Jo MW, Lee SI. Measuring health related quality of life using EQ-5D in South Korea. J Health Tech Assess 2013;1(1):103-111. (Korean)
- 20. Kim SH, Jo MW, Lee SI. Psychometric properties of the Korean short form-36 health survey version 2 for assessing the general population. Asian Nurs Res (Korean Soc Nurs Sci) 2013;7(2):61-66ArticlePubMed
- 21. Jo MW. Development of the measurement tool for health related quality of life in the Korea National Health and Nutrition Examination Survey. Cheongju: Korea Centers for Disease Control and Prevention; 2014. p. 97 (Korean)
- 22. Lee HJ, Jo MW, Choi SH, Kim YJ, Oh KW. Development and psychometric evaluation of measurement instrument for Korean health-related quality of life. Public Health Wkly Rep 2016;9(24):447-454. (Korean)
- 23. Lee EH, Kim CJ, Cho SY, Chae HJ, Lee S, Kim EJ. Monitoring the use of health-related quality of life measurements in Korean studies of patients with diabetes. J Korean Acad Nurs 2011;41(4):558-567. (Korean)ArticlePubMed
- 24. El Achhab Y, Nejjari C, Chikri M, Lyoussi B. Disease-specific health-related quality of life instruments among adults diabetic: a systematic review. Diabetes Res Clin Pract 2008;80(2):171-184ArticlePubMed
- 25. Hu J, Gruber KJ, Hsueh KH. Psychometric properties of the Chinese version of the SF-36 in older adults with diabetes in Beijing, China. Diabetes Res Clin Pract 2010;88(3):273-281ArticlePubMed
- 26. Jo MW. Valuation of Korean health-related quality of life instrument with 8 items (HINT-8). Cheongju: Korean Centers for Disease Control and Prevention; 2017. p. 28 (Korean)
- 27. van Reenen M, Janssen B. EQ-5D-5L user guide: basic information on how to use the EQ-5D-5L instrument. Rotterdam: EuroQol Research Foundation; 2015. p. 9
- 28. Maruish ME. User’s manual for the SF-36v2 health survey. 3rd ed. Lincoln: Quality Metric Incorporated; 2011. p. 198
- 29. Brazier JE, Roberts J. The estimation of a preference-based measure of health from the SF-12. Med Care 2004;42(9):851-859ArticlePubMed
- 30. Brazier J, Roberts J, Deverill M. The estimation of a preference-based measure of health from the SF-36. J Health Econ 2002;21(2):271-292ArticlePubMed
- 31. Fayers PM, Hays R, Hays RD. Assessing quality of life in clinical trials: methods and practice. 2nd ed. Oxford; Oxford University Press; 2005. p. 421
- 32. Viera AJ, Garrett JM. Understanding interobserver agreement: the kappa statistic. Fam Med 2005;37(5):360-363PubMed
- 33. Koo TK, Li MY. A guideline of selecting and reporting intraclass correlation coefficients for reliability research. J Chiropr Med 2016;15(2):155-163ArticlePubMedPMC
- 34. Streiner DL, Norman GR, Cairney J. Health measurement scales: a practical guide to their development and use. Oxford: Oxford University Press; 2014. p. 177
- 35. Landis JR, Koch GG. The measurement of observer agreement for categorical data. Biometrics 1977;33(1):159-174ArticlePubMed
- 36. Janssen MF, Pickard AS, Golicki D, Gudex C, Niewada M, Scalone L, et al. Measurement properties of the EQ-5D-5L compared to the EQ-5D-3L across eight patient groups: a multi-country study. Qual Life Res 2013;22(7):1717-1727ArticlePubMedPMCPDF
- 37. Janssen MF, Bonsel GJ, Luo N. Is EQ-5D-5L better than EQ-5D-3L? A head-to-head comparison of descriptive systems and value sets from seven countries. Pharmacoeconomics 2018;36(6):675-697ArticlePubMedPMCPDF
- 38. Mulhern B, Meadows K. The construct validity and responsiveness of the EQ-5D, SF-6D and diabetes health profile-18 in type 2 diabetes. Health Qual Life Outcomes 2014;12: 42ArticlePubMedPMC
- 39. Kiadaliri AA, Eliasson B, Gerdtham UG. Does the choice of EQ-5D tariff matter? A comparison of the Swedish EQ-5D-3L index score with UK, US, Germany and Denmark among type 2 diabetes patients. Health Qual Life Outcomes 2015;13: 145ArticlePubMedPMCPDF
- 40. Koh D, Abdullah AM, Wang P, Lin N, Luo N. Validation of Brunei’s Malay EQ-5D questionnaire in patients with type 2 diabetes. PLoS One 2016;11(11):e0165555ArticlePubMedPMC
Citations
Citations to this article as recorded by

- Smartphone application-based rehabilitation in patients with chronic respiratory and cardiovascular diseases
Chiwook Chung, Ah-Ram Kim, Dongbum Kim, Hee Kwon, Seong Ho Lee, Il-Young Jang, Min-Woo Jo, Do-Yoon Kang, Sei Won Lee
Scientific Reports.2024;[Epub] CrossRef - Chronic Disease Patterns and Their Relationship With Health-Related Quality of Life in South Korean Older Adults With the 2021 Korean National Health and Nutrition Examination Survey: Latent Class Analysis
Mi-Sun Lee, Hooyeon Lee
JMIR Public Health and Surveillance.2024; 10: e49433. CrossRef - Willingness to pay for integrative healthcare services to treat sleep disturbances: Evidence from a nationwide survey
Min Kyung Hyun
European Journal of Integrative Medicine.2023; 58: 102223. CrossRef - Internal Structure of the Health-Related Quality of Life Instrument with 8-Items in a Nationally Representative Population
Eun-Hyun Lee
Journal of Korean Academy of Nursing.2023; 53(3): 359. CrossRef - Obstructive sleep apnea related to mental health, health-related quality of life and multimorbidity: A nationwide survey of a representative sample in Republic of Korea
Mee-Ri Lee, Sung Min Jung, Frances Chung
PLOS ONE.2023; 18(6): e0287182. CrossRef - Smartphone application-based rehabilitation in patients with chronic respiratory and cardiovascular diseases: a randomised controlled trial study protocol
Chiwook Chung, Ah-Ram Kim, Il-Young Jang, Min-Woo Jo, Seongho Lee, Dongbum Kim, Hee Kwon, Do-Yoon Kang, Sei Won Lee
BMJ Open.2023; 13(9): e072698. CrossRef

 , Hyeon-Jeong Lee3
 PubReader
 ePub Link
 Cite
Cite