
Articles
- Page Path
- HOME > J Prev Med Public Health > Volume 56(6); 2023 > Article
-
Original Article
Multilevel Analysis of the Relationship Between Prescribing Institutions and Medication Adherence Among Patients With Hypertension and Diabetes in Korea -
Haryeom Ghang1,2
 , Juhyang Lee1,3
 -
Journal of Preventive Medicine and Public Health 2023;56(6):504-514.
DOI: https://doi.org/10.3961/jpmph.23.252
Published online: October 5, 2023
- 1,084 Views
- 106 Download
1Health Insurance Research Institute, National Health Insurance Service, Wonju, Korea
2Graduate School of Public Administration, Seoul National University, Seoul, Korea
3Graduate School of Public Health, Seoul National University, Seoul, Korea
- Corresponding author: Haryeom Ghang, Health Insurance Research Institute, National Health Insurance Service, 2 Segye-ro, Wonju 26464, Korea E-mail: appletree345@gmail.com
Copyright © 2023 The Korean Society for Preventive Medicine
This is an Open Access article distributed under the terms of the Creative Commons Attribution Non-Commercial License (http://creativecommons.org/licenses/by-nc/4.0/) which permits unrestricted non-commercial use, distribution, and reproduction in any medium, provided the original work is properly cited.
ABSTRACT
-
Objectives
- This study investigated the relationship between prescribing institutions and medication adherence among patients newly diagnosed with hypertension and diabetes.
-
Methods
- This study investigated patients with new prescriptions for hypertension and diabetes in Korea in 2019 with using data collected from general health screenings. A multilevel logistic regression model was applied to explore the relationship between patients’ first prescribing institution and their medication adherence, defined as a medication possession ratio (MPR) over 80%.
-
Results
- The overall adherence rates were 53.7% and 56.0% among patients with hypertension and diabetes, respectively. The intraclass correlation coefficients were 13.2% for hypertension and 13.8% for diabetes (p<0.001), implying that the first prescribing institution had a significant role in medication adherence. With clinics as the reference group, all other types of hospitals showed an odds ratio (OR) less than 1.00, with the lowest for tertiary hospitals (OR, 0.30 for hypertension; 0.45 for diabetes), and the next lowest in health screening specialized clinics (OR, 0.51 for hypertension; 0.46 for diabetes). Among individual-level variables, female sex, older age, higher insurance premium level, and residing in cities were positively associated with adherence in both the hypertension and diabetes samples.
-
Conclusions
- This study showed that the prescribing institution had a significant relationship with medication adherence. When the first prescribing institution was a clinic, newly diagnosed patients were more likely to adhere to their medication. These results highlight the important role played by primary care institutions in managing mild chronic diseases.
- Chronic diseases, which account for 74% of total global deaths and 79.6% of deaths in Korea [1,2], are attributed to a combination of genetic, physiological, environmental, and behavioral factors. The socioeconomic burden of chronic diseases is increasing, with medical expenses for hypertension and diabetes reaching 7.5 trillion won in Korea in 2021 [3].
- Adherence to medication is recognized as one of the most effective interventions for treating chronic diseases [4-9]. Therefore, it is important to identify the factors that influence medication adherence in order to assist patients in maintaining their medication regimen. While a substantial body of literature addresses this topic, the focus is often on individual-level factors such as health behavior and health status [10-14], or on the effects of program interventions or medication instruction [14,15]. Regional-level factors have also been evaluated to ascertain significant differences in regional adherence rates, after adjusting for both individual and regional level factors. These factors include the number of hospital beds, total hospitals, tertiary hospitals, general hospitals, clinics, and pharmacies, as well as regional gross domestic product [16].
- Whereas numerous studies have explored the relationship between medication adherence and patient characteristics [10-14], fewer have been published concerning the impact of healthcare providers on patients’ medication-taking behavior [17]. The effect at the pharmacy level reportedly accounts for over 12% of the total variation in adherence to antidiabetic medications, according to an analysis using insurance claims data. This finding implies that the efforts made by pharmacies could exert varying degrees of influence on patients’ adherence to prescribed medication regimens. Other factors associated with adherence include the patient’s age and sex, use of mail-order pharmacies, and prescription drug copays [17].
- Medication adherence is a patient behavior influenced not only by patient characteristics but also by a variety of other factors, including health care providers. In Korea, despite public health policy emphasizing the importance of primary care in managing hypertension and diabetes, patients often regularly visit general or tertiary hospitals instead of clinics solely to obtain their prescriptions. This fragmentation in the health care system can impact patients’ medication adherence, with the health care provider playing a significant role. However, the influence of healthcare providers or healthcare systems on medication adherence is not well understood. While a previous study reported that pharmacies significantly influence patient medication adherence, as determined through sensitivity analysis, the pharmacy-level factors considered were limited to regional covariates such as racial distribution, number of pharmacists, and percentage of uninsured individuals [17]. Therefore, this study was conducted to evaluate the effect of the prescriber on medication adherence, particularly for newly diagnosed patients with hypertension and diabetes, using insurance claims data and applying multilevel analysis.
INTRODUCTION
- Data Sources and Study Participants
- This study utilized data from general health checkups and claims provided by the National Health Insurance Service (NHIS) between 2018 and 2021. The population under investigation comprised patients with hypertension or diabetes who discovered their conditions through general health screenings in Korea in 2019 and were prescribed medication at least once within a year from their individual health screening date.
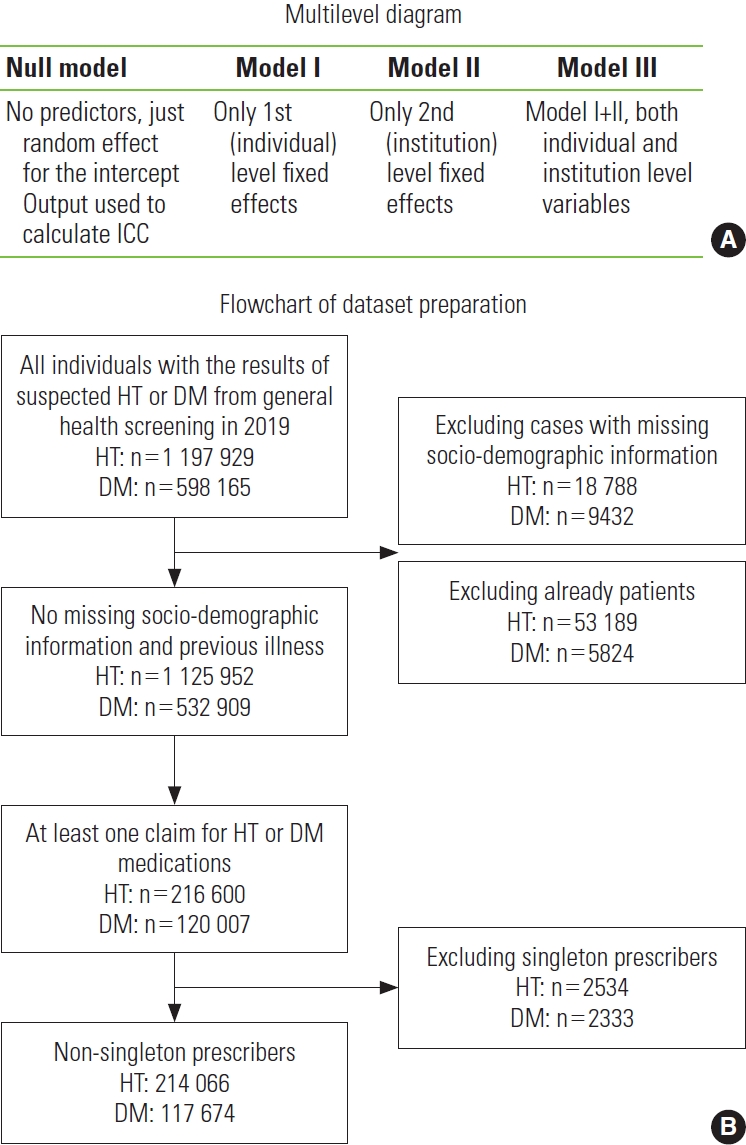
- Participants for the hypertension and diabetes analyses were gathered separately. Initially, potential hypertension cases were identified from the 2019 general health screening database (n=1 197 929). Cases with missing demographic information were then excluded (n=18 788). For the remaining 1 179 141 cases, health insurance claims data were collected for one year both prior to and following the individual health screening date. The data from the previous year was used to exclude patients who were already being treated for hypertension. A patient was defined as an individual who had been hospitalized at least once or had visited medical institutions at least three times for a hypertensive condition (“I10, I11, I12, I13, I15”) as either the primary or first subsidiary diagnosis during the 1-year period [18]. The subsequent year’s data was used to compile the individual’s prescription details, primarily consisting of the prescriber’s ID and location, prescription date, the prescribed medicine, and the duration of medication supply. After excluding patients who were already being treated (n=53 189), only 216 600 out of 1 125 952 individuals were found to have been prescribed antihypertensive medicines during the follow-up period. These 216 600 cases were then grouped by their initial prescriber to form the prescriber cluster. Finally, individuals belonging to singleton prescriber clusters were excluded (n=2534) because there would be no within-cluster variation for prescribers with a cluster size of 1. Data from the participants with diabetes were prepared in a similar process. As Figure 1 and Supplemental Material 1 show, the final sample size was 214 066 individuals clustered in 12 552 prescribers for hypertension and 117 674 individuals clustered in 9470 prescribers for diabetes.
- Measures
- The outcome variable analyzed in this study was medication adherence. We calculated the medication possession ratio (MPR) based on the days’ supply recorded in all prescription claims, by dividing the total days supplied by a one-year period commencing from the index date. If the calculated MPR was 80% or higher, the patient was classified as adherent [12]. All prescriptions for antihypertensive or antidiabetic medications were individually considered when calculating the MPR for each disease.
- For the analysis of patients with hypertension, individuallevel variables included systolic blood pressure, diastolic blood pressure, body mass index (BMI), and previous health screening results for suspected hypertension. In the analysis of patients with diabetes, fasting blood sugar (FBS) and previous health screening results for suspected diabetes were used as individual-level variables, replacing blood pressure and suspected hypertension results. Demographic variables such as sex, age group, insurance premium level, and residential area were also incorporated as individual-level variables. The patient’s insurance premium level was re-categorized into 5 groups: Medical Aid, quantiles 1-5, quantiles 6-10, quantiles 11-15, and quantiles 16-20, serving as a proxy for household income.
- The prescriber served as the clustering factor, and the prescriber’s category, location, and the number of prescribers per 1000 people in the district were used as institutional-level variables. Prescribers were divided into 6 categories: tertiary hospitals, general hospitals, hospitals, clinics, health screening specialized clinics (HSSCs), and a group labeled “others.” The “others” group included long-term hospitals, public health clinics, dental hospitals, and Korean traditional hospitals. We reclassified 109 clinics as HSSCs, as these primarily offered health screenings rather than general health consultations. This reclassification was based on 2019 annual claim data, which showed that these clinics submitted more claims for health screenings than for general health consultations. The number of prescribers in each district (si [city], gun [county], or gu [district]) was determined by dividing the total number of prescribing institutions by the number of residents per 1000 in 2019. The distribution of the non-adherent population rate, according to the prescriber’s category, can be found in Supplemental Material 1.
- Statistical Analysis
- To examine whether there is a prescriber effect on medication adherence, we applied multilevel logistic regression analysis. Patients with hypertension or diabetes typically visit their doctors regularly for prescriptions; thus, these regular patients are hierarchically nested within a prescriber’s cluster. Given that the characteristics of the higher group can influence the outcome in hierarchical data, it is advisable to use multilevel modeling. This approach helps to correct for biases in parameter estimates that may arise from such clustering [19].
- To check whether the multilevel modeling was properly applied, intraclass correlation coefficients (ICCs) were estimated by
- where
- We developed 4 types of models, including a null model, as shown in Figure 1. The null model incorporated only the outcome variable to test for a clustering effect using a 2-level random intercept model. Model I included only individual-level variables such as sex, age group, insurance premium quantile, residence, previous health screening result (only in the hypertension sample), BMI, and blood pressure for patients with hypertension or FBS for those with diabetes. The previous health screening result was excluded from the diabetes analysis due to the lack of a significant difference between the adherent and non-adherent groups. Model II incorporated only institutional-level variables, namely the prescriber’s category, the prescriber’s location, and the number of prescribers in the district. Model III, the full model, included all individual and institutional variables. The prescriber’s institutional ID was utilized as the clustering variable in each model.
- Descriptive statistics were employed to examine the individual and institutional characteristics of the study population. The chi-square test was utilized to assess differences in medication adherence within each categorical variable. For continuous variables, such as blood pressure, BMI, FBS, and the number of prescribers in the district, the t-test was applied, as demonstrated in Table 1.
- We used SAS version 9.4 (SAS Institute Inc., Cary, NC, USA) for all statistical analyses; specifically, the PROC GLIMMIX procedure was applied to conduct multilevel logistic analyses.
- Ethics Statement
- Since this study used raw National Health Insurance claims data, it was approved by the Institutional Review Board at the Health Insurance Research Institute (No. 2022-HR-01-004).
METHODS
Outcome variables
Individual-level variables
Institutional-level variables
- Baseline Characteristics of the Study Population
- Table 1 shows the distribution of adherence in the population based on individual-level and institutional-level variables. The total sample size was 214 066 clustered in 12 552 institutions for hypertension and 117 674 clustered in 9470 institutions for diabetes. In both the hypertension and diabetes samples, the non-adherent populations were predominantly individuals under 30 years old, men, medical aid recipients, rural residents, and those without prior health screening results indicating suspected hypertension or diabetes. Non-adherent populations exhibited lower levels of blood pressure or FBS, but higher BMI levels. Non-adherent patients were more commonly found in tertiary hospitals and HSSCs, and in districts with a higher concentration of prescribers.
- Evaluation of Goodness-of-fit in the Multilevel Analysis
- We conducted a multilevel analysis once we had confirmed the absence of multicollinearity among the independent variables. This was verified by variance inflation factors ranging from 1.02 to 2.89 for the hypertension analysis, and 1.02 to 2.82 for the diabetes analysis.
- In a multilevel analysis, it is important to check that the multilevel modeling was properly applied. To determine whether there was a clustering effect, we estimated ICCs from the null models. The ICC was estimated at 13.2% for the hypertension null model and 13.8% for the diabetes null model, both with a p-value of less than 0.001 (Table 2). This suggests that the institutional-level factor, namely the first prescriber, accounts for either 13.2% or 13.8% of the total variation in medication adherence. Given that ICCs are recommended to fall within a 5-25% range for research in the social sciences [21], the use of multilevel analysis in this study was deemed appropriate.
- The Akaike information criterion (AIC) was used for the model-fit statistics. A lower AIC indicates a better fit; thus, model III, which incorporated both individual- and institutional-level variables, was ultimately chosen for interpretation. However, the variable representing the prescriber’s location was omitted in the full model, as the AIC value was smaller without it. The AIC for model III was 277 914.0 in the hypertension analysis and 152 402.7 in the diabetes analysis (Table 2).
- Relationship Between the Prescribing Institution and Medication Adherence
- Table 3 shows the results of a multilevel analysis concerning adherence to antihypertensive medication among Korean patients. Females, patients over the age of 30, individuals with a higher insurance premium level, and city dwellers were more likely to adhere to their antihypertensive medications. Additionally, patients with prior health screening results indicating suspected hypertension and elevated blood pressure were also more likely to adhere to their prescribed medications.
- When the prescriber’s category was other than a clinic, the odds ratio (OR) of medication adherence fell below 1.00. For instance, patients who received their initial prescription from a tertiary hospital were 0.30 times less likely to adhere to their medication regimen than those who received their first prescription from a clinic. Similarly, patients who received their first prescription from a general hospital, a regular hospital, or an HSSC were also less likely to adhere to their medication, with ORs of 0.53, 0.55, and 0.51 respectively. Furthermore, the likelihood of adherence to antihypertensive medications decreased as the number of prescribers in a district increased. The institution’s location was omitted from the final model because excluding it resulted in a better model fit, as indicated by a decrease in the AIC by 20.7.
- Table 4 presents the results of a multilevel analysis of antidiabetic medication adherence among Korean patients. Females, patients over the age of 30, individuals with the highest insurance premium level, and city dwellers were more likely to adhere to their antidiabetic medications. Additionally, patients with elevated FBS levels and a higher BMI showed a slightly increased likelihood of medication adherence.
- When the prescribing entity was something other than a clinic, the OR of medication adherence fell below 1.00. For instance, patients who received their initial prescription from a tertiary hospital were 0.45 times less likely to adhere to their medication regimen compared to those who received their first prescription from a clinic. Similarly, patients who received their first prescription from a general hospital, a regular hospital, or an HSSC were also less likely to adhere to their medication, with ORs of 0.64, 0.51, and 0.46 respectively. Furthermore, a higher number of prescribers within a district was correlated with lower adherence to antidiabetic medications. The location of the institution was omitted from the final model, as the model demonstrated a better fit without it, as shown by an AIC difference of 4.3.
RESULTS
Hypertension sample
Diabetes sample
- This study aimed to investigate the variation in medication adherence for antihypertensive and antidiabetic medications, as influenced by prescriber-level differences. We operated under the assumption that the initial prescribing institution could potentially impact adherence to antihypertensive and antidiabetic medications among newly diagnosed patients. To explore this, we created a nested dataset of individual medication adherence, grouped by the first prescriber. However, we excluded singleton prescribers, as there would be no within-cluster variation for these cases. Interestingly, non-adherence rates were higher for singleton prescribers, as detailed in Supplemental Materials 1 and 2. For the purposes of this study, we defined the prescriber as the medical institution where the prescription was first written, following the patient’s review of suspected hypertension and diabetes results from a general health screening. As we excluded those who had already been managing the disease prior to the health screening, the study population is thought to be composed of newly diagnosed patients.
- The results indicated that the prescriber played a significant role in accounting for the variation in patients’ adherence to medication. The variances between institutions were statistically significant, with the ICCs estimated at 13.2% and 13.8% for the hypertension and diabetes samples, respectively. This suggests that over 13% of the total variation in adherence can be attributed to the prescriber.
- Patients were more likely to adhere to antihypertensive and antidiabetic medications when their initial prescription was issued in a clinic. Conversely, when the first prescription was written in a tertiary hospital, the OR for adherence dropped to 0.30 for antihypertensive medications and 0.45 for antidiabetic medications. Similarly, patients whose initial prescriptions were issued in an HSSC were also less likely to adhere to their was found to be negatively associated with medication adherence, with ORs of 0.95 for antihypertensive and 0.96 for antidiabetic medications. This finding contrasts with a previous study that found a positive association between the number of pharmacists and medication adherence [17]. These differing results may be attributable to the distinct roles of physicians and pharmacists. In a previous study, statin adherence was found to be negatively associated with the number of patients per physician, while the adherence rate increased with the number of patients per patronized pharmacy [23].
- Regarding individual-level factors, women and older patients were more likely to be adherent to their medications with the exception of those over 69 years of age, who demonstrated a lower OR than patients in their 60s. Patients who contributed higher insurance premiums were more likely to adhere to their medications for both diseases, with this effect being more pronounced in patients with hypertension. These findings align with previously reported results [10-12,14,17]. While studies conducted in the United States have indicated that higher copayments are negatively associated with adherence [17,23-25], it should be noted that patients who pay higher copayments typically have health plans with lower monthly premiums in the United States [26]. Therefore, both sets of results essentially convey the same message: patients with higher incomes tend to be more adherent. Additionally, patients residing in urban areas had a slightly higher OR than those living in rural areas. For patients with hypertension, adherence was more likely (OR, 1.14) when previous general health screenings yielded similar results of suspected hypertension. The patients’ blood pressure and FBS levels also exhibited weak but positive effects on medication adherence.
- This study has several limitations. First, medication adherence may be overestimated as we calculated the MPR using the days’ supply recorded in insurance claims data, which does not precisely indicate the actual ingestion of medication. However, MPR is currently the best measure for identifying nonadherent patients when actual data on pills taken is not available, as patients whose prescription days fall short for a given period cannot fully adhere to their medication [12,27]. Second, our study population was selected from general health screening data, which could lead to an underestimation of pill-taking behavior in elderly patients over 80 years of age. The general health screening rate for this age group was 45.8% in 2019, compared to 75.2% for other age groups [28]. Therefore, caution should be exercised when applying the results of this study to the elderly age group. Lastly, this study was designed to evaluate the effect of the prescriber on medication adherence; thus, the impact of the pharmacy was not considered in the analysis. Previous studies suggest that physicians and pharmacists have different effects on medication adherence, so further research is needed to address this issue.
- In summary, this study suggests that clinics can help patients take their antihypertensive or antidiabetic medication regularly. This finding supports the policy direction of bolstering primary care in the management of mild chronic diseases. A primary care-based chronic disease management program is currently operational in certain districts (for instance, 105 districts in 2021) [29]. It is anticipated that this program will soon expand nationwide. As patients can establish a strong relationship with a local, more approachable doctor, primary care physicians are in a position to provide more effective treatment methods for chronic diseases.
DISCUSSION
SUPPLEMENTAL MATERIALS
Supplemental Material 1.
Supplemental Material 2.
-
CONFLICT OF INTEREST
The authors have no conflicts of interest associated with the material presented in this paper.
-
FUNDING
None.
-
AUTHOR CONTRIBUTIONS
Both authors contributed equally to conceiving the study, analyzing the data, and writing this paper.
Notes
ACKNOWLEDGEMENTS
| Characteristics |
Hypertension |
Diabetes |
||||||||
|---|---|---|---|---|---|---|---|---|---|---|
| Non-adherent | Adherent | Total | p-value | Non-adherent | Adherent | Total | p-value | |||
| Total | 99 229 (46.4) | 114 837 (53.7) | 214 066 (100) | <0.001 | 51 775 (44.0) | 65 899 (56.0) | 117 674 (100) | <0.001 | ||
| Individual-level variables | ||||||||||
| Sex | ||||||||||
| Male | 63 459 (48.6) | 67 058 (51.4) | 130 517 (61.0) | <0.001 | 35 389 (45.5) | 42 455 (54.5) | 77 844 (66.2) | <0.001 | ||
| Female | 35 770 (42.8) | 47 779 (57.2) | 83 549 (39.0) | 16 386 (41.1) | 23 444 (58.9) | 39 830 (33.8) | ||||
| Age (y) | ||||||||||
| <30 | 1778 (60.7) | 1150 (39.3) | 2928 (1.4) | <0.001 | 920 (50.8) | 892 (49.2) | 1812 (1.5) | <0.001 | ||
| 30-39 | 9904 (52.5) | 8973 (47.5) | 18 877 (8.8) | 4332 (46.1) | 5057 (53.9) | 9389 (8.0) | ||||
| 40-49 | 24 905 (45.7) | 29 584 (54.3) | 54 489 (25.5) | 11 873 (43.3) | 15 564 (56.7) | 27 437 (23.3) | ||||
| 50-59 | 29 213 (44.3) | 36 677 (55.7) | 65 890 (30.8) | 16 910 (43.6) | 21 885 (56.4) | 38 795 (33.0) | ||||
| 60-69 | 20 836 (44.6) | 25 847 (55.4) | 46 683 (21.8) | 12 088 (43.5) | 15 723 (56.5) | 27 811 (23.6) | ||||
| ≥70 | 12 593 (50.0) | 12 606 (50.0) | 25 199 (11.8) | 5652 (45.5) | 6778 (54.5) | 12 430 (10.6) | ||||
| Insurance premium level (quantile) | ||||||||||
| Medical Aid | 1029 (52.8) | 921 (47.2) | 1950 (0.9) | <0.001 | 623 (45.5) | 747 (54.5) | 1370 (1.2) | 0.046 | ||
| 1-5 | 19 980 (45.9) | 23 574 (54.1) | 43 554 (20.3) | 10 999 (44.3) | 13 825 (55.7) | 24 824 (21.1) | ||||
| 6-10 | 20 918 (46.8) | 23 819 (53.2) | 44 737 (20.9) | 10 690 (44.3) | 13 467 (55.8) | 24 157 (20.5) | ||||
| 11-15 | 26 963 (46.9) | 30 564 (53.1) | 57 527 (26.9) | 13 948 (44.2) | 17 582 (55.8) | 31 530 (26.8) | ||||
| 16-20 | 30 339 (45.8) | 35 959 (54.2) | 66 298 (31.0) | 15 515 (43.4) | 20 278 (56.7) | 35 793 (30.4) | ||||
| Residence | ||||||||||
| Rural | 8429 (49.3) | 8672 (50.7) | 17 101 (8.0) | <0.001 | 4514 (47.2) | 5052 (52.8) | 9566 (8.1) | <0.001 | ||
| Metropolitan city | 40 624 (46.4) | 47 019 (53.7) | 87 643 (40.9) | 22 119 (44.0) | 28 158 (56.0) | 50 277 (42.7) | ||||
| Small and medium-sized city | 50 176 (45.9) | 59 146 (54.1) | 109 322 (51.1) | 25 142 (43.5) | 32 689 (56.5) | 57 831 (49.1) | ||||
| Previous health screening result of suspected hypertension (or diabetes) | ||||||||||
| No | 58 028 (47.8) | 63 305 (52.2) | 121 333 (56.7) | <0.001 | 26 926 (44.1) | 34 086 (55.9) | 61 012 (51.8) | 0.338 | ||
| Yes | 41 201 (44.4) | 51 532 (55.6) | 92 733 (43.3) | 24 849 (43.9) | 31 813 (56.2) | 56 662 (48.2) | ||||
| Systolic BP | 150.7±13.3 | 152.4±14.0 | 151.6±13.7 | <0.001 | - | - | - | - | ||
| Diastolic BP | 93.9±10.7 | 94.7±11.0 | 94.3±10.8 | <0.001 | - | - | - | - | ||
| FBS | - | - | - | 175.8±57.6 | 186.1±62.0 | 181.6±60.3 | <0.001 | |||
| BMI | 26.0±4.0 | 25.9±3.8 | 26.0±3.9 | <0.001 | 26.5±4.0 | 26.5±4.0 | 26.5±4.0 | 0.009 | ||
| Institutional-level variables | ||||||||||
| Category | ||||||||||
| Clinic | 63 194 (41.8) | 88 077 (58.2) | 151 271 (70.7) | <0.001 | 28 491 (39.0) | 44 504 (61.0) | 72 995 (62.0) | <0.001 | ||
| Tertiary hospital | 5794 (71.9) | 2264 (28.1) | 8058 (3.8) | 3277 (59.3) | 2250 (40.7) | 5527 (4.7) | ||||
| General hospital | 14 183 (55.9) | 11 202 (44.1) | 25 385 (11.9) | 9437 (48.1) | 10 205 (52.0) | 19 642 (16.7) | ||||
| Hospital | 11 618 (55.0) | 9489 (45.0) | 21 107 (9.9) | 7935 (53.4) | 6927 (46.6) | 14 862 (12.6) | ||||
| HSSC1 | 2948 (58.9) | 2059 (41.1) | 5007 (2.3) | 2216 (58.3) | 1584 (41.7) | 3800 (3.2) | ||||
| Other2 | 1492 (46.1) | 1746 (53.9) | 3238 (1.5) | 419 (49.4) | 429 (50.6) | 848 (0.7) | ||||
| Location | ||||||||||
| Rural | 5909 (46.9) | 6688 (53.1) | 12 597 (5.9) | <0.001 | 2903 (46.4) | 3355 (53.6) | 6258 (5.3) | <0.001 | ||
| Metropolitan city | 43 449 (47.1) | 48 902 (53.0) | 92 351 (43.1) | 23 980 (44.5) | 29 898 (55.5) | 53 878 (45.8) | ||||
| Small and medium-sized city | 49 871 (45.7) | 59 247 (54.3) | 109 118 (51.0) | 24 892 (43.3) | 32 646 (56.7) | 57 538 (48.9) | ||||
| No. of prescribers in the district3 | 1.98±0.91 | 1.91±0.78 | 1.94±0.84 | <0.001 | 1.97±0.87 | 1.93±0.80 | 1.95±0.83 | <0.001 | ||
Values are presented as number (%) or mean±standard deviation.
BP, blood pressure; FBS, fasting blood sugar; BMI, body mass index; HSSC, health screening specialized clinic.
1 Health screenings are more provided than general health consultations based on claims data in 2019.
2 Long-term hospitals, public health clinics, dental hospitals, and Korean traditional hospitals were included in the “other” group.
3 Calculated as the total number of prescribing institutions divided by 1000 residents in the district in 2019.
| Variables | Null | Model I | Model II | Model III | |
|---|---|---|---|---|---|
| Hypertension | Between-institution variance (SE) | 0.50 (0.01)*** | 0.51 (0.01)*** | 0.43 (0.01)*** | 0.43 (0.01)*** |
| ICC (%) | 13.2 | - | - | - | |
| AIC | 281 067.8 | 278 619.9 | 280 338.1 | 277 914.0 | |
| Diabetes | Between-institution variance (SE) | 0.53 (0.02)*** | 0.55 (0.02)*** | 0.45 (0.02)*** | 0.47 (0.02)*** |
| ICC (%) | 13.8 | - | - | - | |
| AIC | 154 422.8 | 152 926.1 | 153 897.6 | 152 402.7 |
| Variables | Model I | Model II | Model III | ||
|---|---|---|---|---|---|
| Individual-level variables | |||||
| Sex | |||||
| Male | 1.00 (reference) | - | 1.00 (reference) | ||
| Female | 1.29 (1.26, 1.31)*** | - | 1.28 (1.25, 1.31)*** | ||
| Age (y) | |||||
| <30 | 1.00 (reference) | - | 1.00 (reference) | ||
| 30-39 | 1.35 (1.24, 1.47)*** | - | 1.29 (1.18, 1.40)*** | ||
| 40-49 | 1.72 (1.58, 1.87)*** | - | 1.64 (1.51, 1.79)*** | ||
| 50-59 | 1.84 (1.69, 2.00)*** | - | 1.76 (1.62, 1.91)*** | ||
| 60-69 | 1.88 (1.73, 2.05)*** | - | 1.79 (1.65, 1.95)*** | ||
| ≥70 | 1.48 (1.35, 1.61)*** | - | 1.41 (1.29, 1.54)*** | ||
| Insurance premium level (quantile) | |||||
| Medical Aid | 1.00 (reference) | - | 1.00 (reference) | ||
| 1-5 | 1.28 (1.16, 1.42)*** | - | 1.26(1.14, 1.39)*** | ||
| 6-10 | 1.28 (1.16, 1.41)*** | - | 1.25 (1.13, 1.38)*** | ||
| 11-15 | 1.32 (1.20, 1.46)*** | - | 1.29 (1.17, 1.42)*** | ||
| 16-20 | 1.44 (1.30, 1.58)*** | - | 1.41 (1.27, 1.55)*** | ||
| Residence | |||||
| Rural | 1.00 (reference) | - | 1.00 (reference) | ||
| Metropolitan city | 1.14 (1.09, 1.20)*** | - | 1.13 (1.08, 1.19)*** | ||
| Small and medium-sized city | 1.15 (1.10, 1.20)*** | - | 1.13 (1.08, 1.18)*** | ||
| Previous health screening result of suspected hypertension | |||||
| No | 1.00 (reference) | - | 1.00 (reference) | ||
| Yes | 1.14 (1.12, 1.17)*** | - | 1.14 (1.12, 1.17)*** | ||
| Systolic blood pressure | 1.01 (1.01, 1.01)*** | - | 1.01 (1.01, 1.01)*** | ||
| Diastolic blood pressure | 1.00 (1.00, 1.01)*** | - | 1.00 (1.00, 1.01)*** | ||
| Body mass index | 1.00 (1.00, 1.00) | - | 1.00 (1.00, 1.00) | ||
| Institutional-level variables | |||||
| Category | |||||
| Clinic | - | 1.00 (reference) | 1.00 (reference) | ||
| Tertiary hospital | - | 0.27 (0.22, 0.34)*** | 0.30 (0.24, 0.37)*** | ||
| General hospital | - | 0.52 (0.48, 0.57)*** | 0.53 (0.49, 0.57)*** | ||
| Hospital | - | 0.55 (0.52, 0.59)*** | 0.55 (0.51, 0.58)*** | ||
| HSSC2 | - | 0.51 (0.42, 0.63)*** | 0.51 (0.42, 0.63)*** | ||
| Other3 | - | 0.82 (0.74, 0.91)*** | 0.83 (0.75, 0.93)** | ||
| Location | |||||
| Rural | - | 1.00 (reference) | - | ||
| Metropolitan city | - | 1.12 (1.05, 1.19)*** | - | ||
| Small and medium-sized city | - | 1.11 (1.04, 1.18)** | - | ||
| No. of prescribers in the district4 | - | 0.95 (0.93, 0.97)*** | 0.95 (0.93, 0.97)*** | ||
Values are presented as odds ratio (95% confidence interval).
HSSC, health screening specialized clinic.
1 Model I: only individual-level variables included; Model II: only institutional-level variables included; Model III: both individual-level and institutional-level variables included.
2 Health screenings are more provided than general health consultations based on claims data in 2019.
3 Includes long term hospitals, public health clinics, dental hospitals, and Korean traditional hospitals.
4 Calculated as the total number of prescribing institutions divided by 1000 residents in the district in 2019.
** p<0.01,
*** p<0.001.
| Variables | Model I | Model II | Model III | ||
|---|---|---|---|---|---|
| Individual-level variables | |||||
| Sex | |||||
| Male | 1.00 (reference) | - | 1.00 (reference) | ||
| Female | 1.24 (1.21, 1.28)*** | - | 1.23 (1.20, 1.26)*** | ||
| Age (y) | |||||
| <30 | 1.00 (reference) | - | 1.00 (reference) | ||
| 30-39 | 1.30 (1.16, 1.45)*** | - | 1.24 (1.11, 1.38)*** | ||
| 40-49 | 1.54 (1.39, 1.71)*** | - | 1.52 (1.37, 1.69)*** | ||
| 50-59 | 1.62 (1.46, 1.80)*** | - | 1.58 (1.42, 1.75)*** | ||
| 60-69 | 1.71 (1.54, 1.90)*** | - | 1.67 (1.50, 1.85)*** | ||
| ≥70 | 1.54 (1.38, 1.72)*** | - | 1.49 (1.34, 1.67)*** | ||
| Insurance premium level (quantile) | |||||
| Medical Aid | 1.00 (reference) | - | 1.00 (reference) | ||
| 1-5 | 1.05 (0.93, 1.18) | - | 1.03 (0.92, 1.16) | ||
| 6-10 | 1.07 (0.95, 1.21) | - | 1.06 (0.94, 1.20) | ||
| 11-15 | 1.11 (0.98, 1.25) | - | 1.10 (0.98, 1.24) | ||
| 16-20 | 1.19 (1.05, 1.34)** | - | 1.16 (1.03, 1.31)* | ||
| Residence | |||||
| Rural | 1.00 (reference) | - | 1.00 (reference) | ||
| Metropolitan city | 1.15 (1.08, 1.22)*** | - | 1.13 (1.06, 1.19)*** | ||
| Small and medium-sized city | 1.17 (1.10, 1.23)*** | - | 1.13 (1.07, 1.19)*** | ||
| Fasting blood sugar | 1.00 (1.00, 1.00)*** | - | 1.00 (1.00, 1.00)*** | ||
| Body mass index | 1.01 (1.00, 1.01)** | - | 1.01 (1.00, 1.01)** | ||
| Institutional-level variables | |||||
| Category | |||||
| Clinic | - | 1.00 (reference) | 1.00 (reference) | ||
| Tertiary hospital | - | 0.42 (0.34, 0.53)*** | 0.45 (0.36, 0.56)*** | ||
| General hospital | - | 0.62 (0.57, 0.67)*** | 0.64 (0.59, 0.70)*** | ||
| Hospital | - | 0.51 (0.48, 0.55)*** | 0.51 (0.47, 0.54)*** | ||
| HSSC2 | - | 0.48 (0.38, 0.60)*** | 0.46 (0.36, 0.58)*** | ||
| Other3 | - | 0.68 (0.57, 0.82)*** | 0.67 (0.55, 0.80)*** | ||
| Location | |||||
| Rural | - | 1.00 (reference) | - | ||
| Metropolitan city | - | 1.18 (1.09, 1.29)*** | - | ||
| Small and medium-sized city | - | 1.20 (1.10, 1.30)*** | - | ||
| No. Prescribers in the district4 | - | 0.97 (0.94, 1.00)* | 0.96 (0.94, 0.99)** | ||
Values are presented as odds ratio (95% confidence interval).
HSSC, health screening specialized clinic.
1 Model I: only individual-level variables included; Model II: only institutional-level variables included; Model III: both individual-level and institutional-level variables included.
2 Health screenings are more provided than general health consultations based on claims data in 2019.
3 Includes long term hospitals, public health clinics, dental hospitals, and Korean traditional hospitals.
4 Calculated as the total number of prescribing institutions divided by 1000 residents in the district in 2019.
* p<0.05,
** p<0.01,
*** p<0.001.
- 1. World Health Organization. Noncommunicable diseases. 2023 [cited 2023 May 22]. Available from: https://www.who.int/news-room/fact-sheets/detail/noncommunicable-diseases
- 2. Korea Disease Control and Prevention Agency. 2022 Chronic disease fact book. Cheongju: Korea Disease Control and Prevention Agency; 2022. p. 6 (Korean)
- 3. National Health Insurance Service; Health Insurance Review and Assessment Service. 2021 National health insurance statistical yearbook. Wonju: National Health Insurance Service, Health Insurance Review and Assessment Service; 2022. p. 22 (Korean)
- 4. Lee EK. Factors associated with hypertension control in Korean adults: the fifth Korea National Health and Nutrition Examination Survey (KNHANES V-2). J Korean Data Anal Soc 2013;15(6):3203-3217. (Korean)
- 5. Han JO, Yim J, Im JS, Lee HY, Park JH, Oh DK. The effects of adherence and hypertension control on complication among newly diagnosed hypertension patients. Health Policy Manag 2015;25(2):90-96. (Korean)Article
- 6. Asche C, LaFleur J, Conner C. A review of diabetes treatment adherence and the association with clinical and economic outcomes. Clin Ther 2011;33(1):74-109ArticlePubMed
- 7. Currie CJ, Peyrot M, Morgan CL, Poole CD, Jenkins-Jones S, Rubin RR, et al. The impact of treatment noncompliance on mortality in people with type 2 diabetes. Diabetes Care 2012;35(6):1279-1284ArticlePubMedPMCPDF
- 8. McGovern A, Tippu Z, Hinton W, Munro N, Whyte M, de Lusignan S. Systematic review of adherence rates by medication class in type 2 diabetes: a study protocol. BMJ Open 2016;6(2):e010469ArticlePubMedPMC
- 9. Egede LE, Gebregziabher M, Dismuke CE, Lynch CP, Axon RN, Zhao Y, et al. Medication nonadherence in diabetes: longitudinal effects on costs and potential cost savings from improvement. Diabetes Care 2012;35(12):2533-2359PubMedPMC
- 10. Kim SO. Medication adherence of elderly with hypertension and/or diabetes-mellitus and its’ influencing factors. Korean J Clin Pharm 2011;21(2):81-89. (Korean)
- 11. Lee MJ, Kang HK, Seo BJ. Correlation between outpatient’s medical adherence and national insurance types in the type 2 diabetes mellitus. J Converg Inf Technol 2018;8(4):9-14. (Korean)
- 12. Park JH, Shin Y, Lee SY, Lee SI. Antihypertensive drug medication adherence and its affecting factors in South Korea. Int J Cardiol 2008;128(3):392-398ArticlePubMed
- 13. Yoon SJ. The relationships of health literacy, medication adherence and self-care performance of diabetes mellitus patients. Health Nurs 2017;29(1):27-38. (Korean)
- 14. Kim S, Jang S. Influence of multiple health risk behaviors of hypertension / diabetes patients on drug adherence. J Korean Acad Manag Care Pharm 2019;7(2):75-85. (Korean)
- 15. Bae MS, Song H. Effect of primary care based chronic disease management program provision characteristics on medication adherence in hypertensive and diabetic patients: focusing on the implication for operation. J Korean Public Health Assoc 2021;47(3):21-31. (Korean)
- 16. Han EB, Kim SJ, Choi HC, Kwon OD, Cho B. Impact of residential area on antihypertensive medication adhrence in Seoul, Korea. Korean J Fam Pract 2021;11(4):272-279. (Korean)Article
- 17. Sharma KP, Taylor TN. Pharmacy effect on adherence to antidiabetic medications. Med Care 2012;50(8):685-691ArticlePubMed
- 18. Lee SM, Ghang H, Lee SH, Kim DW, Kim SJ, Kim SY, et al. Study on the performance monitoring of national health screening: Health Insurance Research Institute (NHIS) · Sejong: Ministry of Health and Welfare; 2022, p.77 (Korean)
- 19. Guo G, Zhao H. Multilevel modeling for binary data. Ann Rev Sociol 2000;26(1):441-462Article
- 20. Austin PC, Merlo J. Intermediate and advanced topics in multilevel logistic regression analysis. Stat Med 2017;36(20):3257-3277ArticlePubMedPMCPDF
- 21. Lee H, Noh S. Advanced statistical analysis: theory and practice. 2nd ed. Goyang: Moonwoosa; 2013. p. 445 (Korean)
- 22. Kim TE. Evaluation of the national health screening program of Korea. Seoul: National Assembly Budget Office; 2021. p. 77-80 (Korean)
- 23. Pedan A, Varasteh L, Schneeweiss S. Analysis of factors associated with statin adherence in a hierarchical model considering physician, pharmacy, patient, and prescription characteristics. J Manag Care Pharm 2007;13(6):487-496ArticlePubMedPMC
- 24. Goldman DP, Joyce GF, Zheng Y. Prescription drug cost sharing: associations with medication and medical utilization and spending and health. JAMA 2007;298(1):61-69ArticlePubMedPMC
- 25. Roblin DW, Platt R, Goodman MJ, Hsu J, Nelson WW, Smith DH, et al. Effect of increased cost-sharing on oral hypoglycemic use in five managed care organizations: how much is too much? Med Care 2005;43(10):951-959PubMed
- 26. US Centers for Medicare & Medicaid Services. Copayment [cited 2023 May 29]. Available from: https://www.healthcare.gov/glossary/co-payment/
- 27. Wandless I, Mucklow JC, Smith A, Prudham D. Compliance with prescribed medicines: a study of elderly patients in the community. J R Coll Gen Pract 1979;29(204):391-396PubMedPMC
- 28. National Health Insurance Service. 2019 National health screening statistical yearbook. Wonju: National Health Insurance Service; 2020. p. 26 (Korean)
- 29. Ministry of Health and Welfare. Announcement of region selection (5th) for primary care based chronic disease management [cited 2023 May 29]. Available from: https://www.mohw.go.kr/react/al/sal0101vw.jsp?PAR_MENU_ID=04&MENU_ID=040102&CONT_SEQ=363954 (Korean)
 PubReader
 ePub Link
 Cite
Cite

