
Articles
- Page Path
- HOME > J Prev Med Public Health > Volume 57(1); 2024 > Article
-
Systematic Review
Adjusting for Confounders in Outcome Studies Using the Korea National Health Insurance Claim Database: A Review of Methods and Applications -
Seung Jin Han1
 , Kyoung Hoon Kim2*
-
Journal of Preventive Medicine and Public Health 2024;57(1):1-7.
DOI: https://doi.org/10.3961/jpmph.23.250
Published online: November 16, 2023
1Review and Assessment Research Institute, Health Insurance Review & Assessment Service, Wonju, Korea
2International Policy Research Division, Health Insurance Review & Assessment Service, Wonju, Korea
- Corresponding author: Kyoung Hoon Kim, International Policy Research Division, Health Insurance Review & Assessment Service, 60 Hyeoksin-ro, Wonju 26465, Korea E-mail: rudqnr@daum.net
- *Current affiliation: Department of Health Administration, Kongju National University College of Nursing and Health, Gongju, Korea.
Copyright © 2024 The Korean Society for Preventive Medicine
This is an Open Access article distributed under the terms of the Creative Commons Attribution Non-Commercial License (http://creativecommons.org/licenses/by-nc/4.0/) which permits unrestricted non-commercial use, distribution, and reproduction in any medium, provided the original work is properly cited.
ABSTRACT
-
Objectives:
- Adjusting for potential confounders is crucial for producing valuable evidence in outcome studies. Although numerous studies have been published using the Korea National Health Insurance Claim Database, no study has critically reviewed the methods used to adjust for confounders. This study aimed to review these studies and suggest methods and applications to adjust for confounders.
-
Methods:
- We conducted a literature search of electronic databases, including PubMed and Embase, from January 1, 2021 to December 31, 2022. In total, 278 studies were retrieved. Eligibility criteria were published in English and outcome studies. A literature search and article screening were independently performed by 2 authors and finally, 173 of 278 studies were included.
-
Results:
- Thirty-nine studies used matching at the study design stage, and 171 adjusted for confounders using regression analysis or propensity scores at the analysis stage. Of these, 125 conducted regression analyses based on the study questions. Propensity score matching was the most common method involving propensity scores. A total of 171 studies included age and/or sex as confounders. Comorbidities and healthcare utilization, including medications and procedures, were used as confounders in 146 and 82 studies, respectively.
-
Conclusions:
- This is the first review to address the methods and applications used to adjust for confounders in recently published studies. Our results indicate that all studies adjusted for confounders with appropriate study designs and statistical methodologies; however, a thorough understanding and careful application of confounding variables are required to avoid erroneous results.
- The use of real-world data (RWD) to support evidence-based decision-making and improve patient health outcomes has been emphasized in health care [1]. However, during this process, potential confounders can lead to misleading causal relationships, thereby obscuring the true effects. Therefore, adjusting for potential confounders is crucial for producing valuable evidence in outcome studies using RWD.
- The National Health Insurance Claim Database (NHICD), a representative source of RWD in Korea, is widely used as a data source in health outcome studies. The database is collected primarily for reimbursement by the Health Insurance Review and Assessment Service, and includes the general characteristics of patients and healthcare providers and information on health service utilization. Controlling for confounders is a core process when conducting health outcome studies using the NHICD. Several methods can be applied to adjust for confounders at the study design and analysis stages [2]. The basic methods used to address confounders at the study design stage include subject restriction, stratification, and matching. At the analysis stage, the regression analysis and propensity score (PS) methods can be used. Kim et al. [3] compared kidney cancer incidence and mortality between patients who used statins and those who did not use them matched by age and sex. Oh et al. [4] investigated the relationship between endocrine treatment and the risk of depression in patients with breast cancer using a Cox proportional hazard model after adjusting for age and comorbidities.
- Systematic approaches, including well-designed studies and employment of proper statistical methods, are required to translate the data from the NHICD into meaningful real-world evidence. Although numerous studies have been published using the data from the NHICD [5], none has critically reviewed the methods used to adjust for potential confounders. Therefore, in this study, we aimed to review recent studies and suggest methods and applications to adjust for confounders.
INTRODUCTION
- Searching for Studies
- We conducted a literature search on PubMed and Embase between January 1, 2021 and December 31, 2022. The search strategy was designed to retrieve all published articles without any restrictions. We used the terms (“Health Insurance Claim Data” or “Health Insurance Claim Database”) and (“South Korea” or “Korea”), and 278 studies were retrieved. The inclusion criteria were: (1) studies originally published in English and (2) outcome studies investigating the causal relationship between exposure and outcomes.
- Selecting Studies
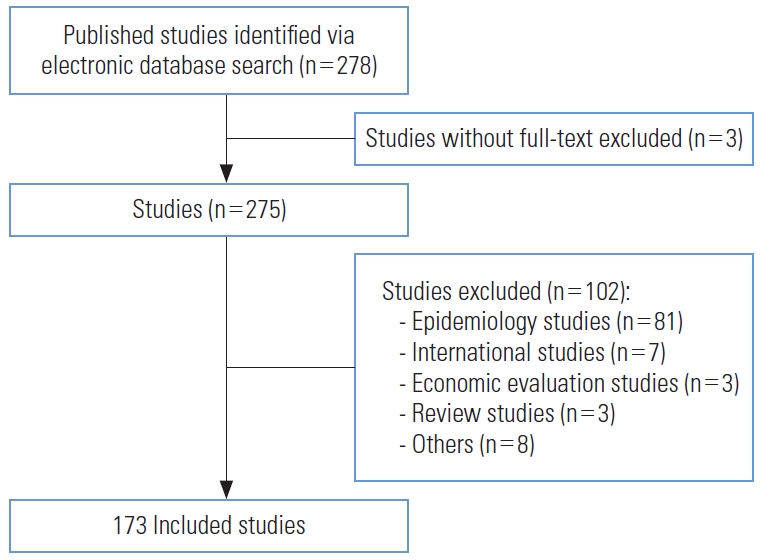
- Literature search and article screening were independently performed by KHK and SJH. After removing duplicates, both authors screened the initial search results for relevance using the titles and abstracts. Full texts were reviewed against the eligibility criteria. There was no substantial disagreement between the authors regarding the inclusion. Three studies without full texts, 3 review articles, 7 international studies, 81 epidemiological studies, 3 economic evaluation studies, and 8 other studies on topics such as prediction model development were excluded. Finally, 173 studies were included for the analysis (Figure 1).
- Ethics Statement
- Ethical approval for this study was waived by the Institutional Review Board of the Health Insurance Review and Assessment Service (No. 2023-040-001) as a study using information open to the public.
METHODS
- Methods to Adjust for Confounders
- All 173 studies applied a restriction method with exclusion criteria to preliminarily control for confounders at the study design stage (Table 1). Thirty-nine studies used 1:1 or 1:n matching with age and/or sex, and some additionally considered comorbidities [6-8] and the index date year [7,9-13] as matching variables. Of these 39 studies, only 2 applied univariate analysis, such as the chi-square test and t-test, to a matched study cohort. Choi and Seo [7] compared the outcomes of patients using a univariate Cox proportional hazard model after the effects of entecavir and tenofovir disoproxil fumarate groups were matched 1:2 based on age, sex, comorbidities, hospital type, and index date year. Yoon et al. [8] investigated the risk of cancer between ranitidine and famotidine users without risk adjustment after matching based on age, sex, diabetes mellitus, and cumulative exposure. The remaining 37 studies controlled for confounders by applying regression analysis and/or PS methods at the analysis stage. Jeong et al. [14] evaluated whether female with moyamoya disease have an increased risk of cerebrovascular disease after delivery. This study matched the cohort at the ratio of 1:10 based on age and parity, and applied a Cox proportional hazard model adjusting for confounding variables. Similarly, Kim et al. [15] extracted data on users and non-users of statins in a 1:4 ratio based on age from the NHICD, and used a Cox proportional hazard model adjusting for confounding variables to compare the incidence and mortality of breast cancer between the 2 groups.
- Among the 173 studies, 171 excluding the 2 that applied matching at the design stage, adjusted for confounders using regression analysis and/or the PS method at the analysis stage (Table 1). Of these, 125 conducted regression analyses such as logistic regression, Cox proportional hazard model, and Poisson regression, depending on the study questions. The PS method was used in 46 studies including 34 that applied both regression analysis and the PS method. There are 4 ways of using the estimated PS: propensity score matching (PSM), stratification according to the PS, inverse probability of treatment weighting (IPTW) using the PS, and covariate adjustment using the PS [16]. There were 38 studies that applied PSM, which was the most frequently used PS method, and no studies that used covariate adjustment. Studies using PSM calculated PS using logistic regression adjusted for confounders and performed 1:1 or 1:n greedy nearest-neighbor matching based on the estimated PS. Park et al. [17] applied PSM to balance the aforementioned baseline characteristics between the prophylaxis and non-prophylaxis groups and then, conducted univariate analysis with the chi-square or Student t-test to estimate the incremental burden in the matched cohort.
- Five studies employed Cox proportional hazard models using IPTW [18], and 1 used IPTW after applying PSM [19]. Song et al. [20] compared the risk of dyslipidemia between patients diagnosed with thyroid cancer and the general population using IPTW and stratification on PS. They estimated the PS for each participant with logistic regression, and divided the data into 3 strata defined by tertiles of PS. Stratified Cox proportional and Cox proportional hazard models were employed within each stratum using IPTW. Thirty-four studies applied regression analysis adjusting for confounding variables in a matched study cohort after performing PSM. Yun et al. [21] used PSM to investigate the risk of osteoporotic fractures after gastrectomy. However, they additionally employed a Cox proportional hazard model adjusting for confounding variables owing to the imbalance between the matched cohorts.
- Application of Potential Confounders
- The list and frequencies of confounders used in the study design and analysis stages of the 173 studies are shown in Table 2. A total of 171 studies included age and/or sex as confounders. The 2 studies without age and sex involved female of childbearing age [22,23]. Comorbidities were applied as confounders in 146 studies. Of these, 123 studies used an ad hoc selection method that selected comorbidities based on clinical judgment and 65 studies used comorbidity measurements such as the Charlson comorbidity index (CCI) or the Elixhauser comorbidity measurement (ECM). In 21 studies, both methods were used. Sixty-two studies used the CCI, 2 studies used the ECM, and 1 used both [24]. Healthcare utilization, including medication, procedures, and history of admission, was considered in 82 studies. Thirty-six and 26 studies used the type of health insurance and characteristics of healthcare providers, including the number of doctors, type and location of hospitals, and volume, respectively. The year of diagnosis and enrollment were employed in 12 studies.
- Variables not recorded in the NHICD were frequently used as confounders. Household income level extracted from the Health Insurance Premium Database was the most frequently used (77 studies). Fifty-one studies used regions (urban and rural areas) extracted from the Korea Resident Registration Database. Lifestyle factors, body mass index, and clinical test results, which are core variables reflecting a patient’s health status and severity of the condition, were used in 44 studies, 30 studies, and 19 studies, respectively. These data were extracted from the National Health Screening Database. Family history, length of stay, and costs were classified as “other.”
RESULTS
- Adjusting for potential confounders is crucial for providing valuable evidence in health outcome studies using the NHICD. All 173 articles reviewed in this study adjusted for confounders at both the study design and analysis stages. In particular, all applied the restriction method with exclusion criteria to control for confounders during the study design. Statistical analysis approaches, including regression analysis and the PS method, were frequently used to control for confounders, which mainly included age, sex, and comorbidities.
- Confounders were controlled more frequently in the analysis than in the design stage, and regression analysis was used more often than the PS method. Regression analysis aims to investigate the relationship between dependent and independent variables, and is widely used in outcome studies. PS methods are also an increasingly common method of controlling for confounders. These methods are reported to be less biased and more robust than regression analysis [25]. Amoah et al. [26] suggested that PSM is generally more favorable than regression analysis for estimating the causal effect; however, it does not compensate for poor study design or data accuracy. Thirty-four (19.7%) of the 173 studies used double adjustment. This can be used to eliminate confounding factors if an imbalance exists after PSM. Standardized differences of less than 0.1 can be practically considered as a sign of balance in baseline characteristics of study cohorts. We often encounter a failure to achieve a balance of confounders between study cohorts after PSM. Nguyen et al. [27] recommended repeating PS modeling until standardized differences below 0.1 are achieved for most confounders, and double adjustment might be worth considering if the imbalance remains.
- Several variables, including age, sex, and comorbidities, were used as confounders. Researchers must understand the characteristics of the variables to apply them accurately. Otherwise, erroneous results may be derived when potential confounders are not controlled. There are several considerations to keep in mind regarding the use of confounding variables. First, comorbidities, which are defined as the co-occurrence of more than 1 disease in the same patient and are associated with worse health outcomes [28], were the second most commonly used confounders. Some guidelines and comparative studies for collecting comorbidities when using the NHICD have been reported for specific conditions [29-31]. However, comprehensive guidelines are required to increase comparability among studies and accurately identify comorbidities.
- Second, the type of health insurance and household income level were used as a proxy for socioeconomic status. In particular, the household income level was used in 77 (44.3%) studies because it reflects socioeconomic status more clearly than the type of health insurance. However, it has limitations that need to be addressed. Health insurance in Korea covers self-employed and employer-insured individuals. The insurance premium is levied based on the proportion of income, vehicles, and other assets for self-employed individuals, and the proportion of monthly income for employer-insured individuals. Therefore, comparing the relative rankings of insurance premiums without distinguishing between the 2 groups does not accurately reflect income levels. There are 3 methods to deal with these issues in the analysis step. First, a stratified analysis can be conducted for self-employed and employer-insured individuals. Second, while insurance premiums are generally divided into 5 grades, it is possible to employ a method that divides them into 10 grades, taking into account both self-employed and employer-insured individuals. Lastly, if PSM is applied, it is possible to calculate PS separately for self-employed and employer-insured individuals, then integrate and use the matched data as a single dataset.
- Third, emergency status needs to be actively used when appropriate; however, no studies used it. This is a meaningful variable that reflects a patient’s health status and severity of condition, although additional work is required to create it using fee codes for emergency care management.
- Lastly, efforts to improve the quality of the NHICD are required. The diagnosis is the core information used to select the study population and identify comorbidities and health services. The problem with the accuracy of the diagnoses recorded in the NHICD is that the diagnoses are for reimbursement, not for clinical purposes. Present on admission (POA), a diagnosis-timing flag, is core information for differentiating between adverse events and comorbidities. A recent study reported that the agreement in POA between the NHICD and reference standard data was poor [32]. Interventions such as monitoring coding practices are required to improve the data quality, including the reliability and accuracy of the diagnoses and POA.
- This study restricted the literature search to English-language publications in 2021 and 2022, which may have caused the exclusion of meaningful studies. However, this is the first review to address the methods and applications of adjusting for confounders in studies using the NHICD. As advanced methodologies to adjust for confounders are being developed and applied, further studies using a comprehensive literature search strategy are required.
DISCUSSION
- Adjustment for confounding factors is a critical component of outcome studies. Our results indicate that all studies adjusted for confounders with appropriate study designs and statistical methodologies; however, a thorough understanding and careful application of confounding variables are required to avoid erroneous results. The review also suggests the need for methodological guidance to improve the quality of outcome studies depending on how confounders, which can distort the observed causal relationship between exposure and outcome, are adjusted.
CONCLUSION
-
Conflict of Interest
The authors have no conflicts of interest associated with the material presented in this paper.
-
Funding
None.
-
Author Contributions
Both authors contributed equally to conceiving the study, analyzing the data, and writing this paper.
Notes
Acknowledgements
|
Study design |
Analysis design |
||||||
|---|---|---|---|---|---|---|---|
| Restriction | Matching | Total | Regression | Regression with PSM |
Univariate analysis with PS |
||
| Matching | IPTW | Other1 | |||||
| 173 (100) | 39 (22.5) | 1712 | 125 (72.3) | 34 (19.7) | 5 (2.9) | 5 (2.9) | 2 (1.2) |
Values are presented as number (%).
PS, propensity score; PSM, propensity score matching; IPTW, inverse probability of treatment weighting.
1 Other: matching and IPTW (n=1); matching, IPTW and stratification (n=1).
2 Of the 173 studies, 2 studies applied only the matching method at the design stage.
- 1. Liu F, Panagiotakos D. Real-world data: a brief review of the methods, applications, challenges and opportunities. BMC Med Res Methodol 2022;22(1):287. https://doi.org/10.1186/s12874-022-01768-6ArticlePubMedPMC
- 2. Jager KJ, Zoccali C, Macleod A, Dekker FW. Confounding: what it is and how to deal with it. Kidney Int 2008;73(3):256-260. https://doi.org/10.1038/sj.ki.5002650ArticlePubMed
- 3. Kim DS, Kim HJ, Ahn HS. Association between statins and the risk of kidney cancer incidence and mortality using the Korean National Health Insurance Claims Database. Cancer Control 2022;29: 10732748221111293. https://doi.org/10.1177/10732748221111293ArticlePubMedPMC
- 4. Oh J, Lee HS, Jeon S, Kim D, Seok JH, Park WC, et al. Risk of developing depression from endocrine treatment: a nationwide cohort study of women administered treatment for breast cancer in South Korea. Front Oncol 2022;12: 980197. https://doi.org/10.3389/fonc.2022.980197ArticlePubMedPMC
- 5. Park JS, Lee CH. Clinical study using healthcare claims database. J Rheum Dis 2021;28(3):119-125. https://doi.org/10.4078/jrd.2021.28.3.119ArticlePubMedPMC
- 6. Kim H, Cho SI, Won S, Han Y, Kwon TW, Cho YP, et al. The prevalence of concomitant abdominal aortic aneurysm and cancer. J Clin Med 2021;10(17):3847. https://doi.org/10.3390/jcm10173847ArticlePubMedPMC
- 7. Choi H, Seo GH. Entecavir versus tenofovir for the prevention of hepatocellular carcinoma in treatment-naïve chronic hepatitis B patients in Korea. J Korean Med Sci 2021;36(14):e89. https://doi.org/10.3346/jkms.2021.36.e89ArticlePubMedPMC
- 8. Yoon HJ, Kim JH, Seo GH, Park H. Risk of cancer following the use of N-nitrosodimethylamine (NDMA) contaminated ranitidine products: a nationwide cohort study in South Korea. J Clin Med 2021;10(1):153. https://doi.org/10.3390/jcm10010153ArticlePubMedPMC
- 9. Lee J, Huh KH, Yoon SR, Lee SY, Lee HS. Pregnancy outcomes after living kidney donation from a nationwide population-based cohort study from Korea. Sci Rep 2022;12(1):22412. https://doi.org/0.1038/s41598-022-27094-xArticlePubMedPMC
- 10. Kim K, Tsai AC, Lowe S, Stewart R, Jung SJ. Urbanicity, posttraumatic stress disorder, and effect modification by socioeconomic position: a nested case-control study of the Korean National Health Insurance Database. Acta Psychiatr Scand 2023;147(1):54-64. https://doi.org/10.1111/acps.13499ArticlePubMed
- 11. Sohn SY, Seo GH, Chung JH. Risk of all-cause mortality in levothyroxine-treated hypothyroid patients: a nationwide Korean cohort study. Front Endocrinol (Lausanne) 2021;12: 680647. https://doi.org/10.3389/fendo.2021.680647ArticlePubMedPMC
- 12. Kim M, Han K, Yoo SA, Lee JH. Herpes zoster and subsequent cancer risk: a nationwide population-based cohort study in Korea. Dermatology 2021;237(1):73-78. https://doi.org/10.1159/000505911ArticlePubMed
- 13. Park EH, Lee JS, Kim YJ, Lee SM, Jun JK, Lee EB, et al. Pregnancy outcomes in Korean women with ankylosing spondylitis. Korean J Intern Med 2021;36(3):721-730. https://doi.org/10.3904/kjim.2019.144ArticlePubMed
- 14. Jeong Y, Jung YJ, Noh E, Ha S, Hwang J, Cho GJ, et al. The risk for future cerebrovascular disease in pregnant women with Moyamoya disease: a nationwide population-based study in South Korea. BMC Pregnancy Childbirth 2022;22(1):433. https://doi.org/10.1186/s12884-022-04718-8ArticlePubMedPMC
- 15. Kim DS, Ahn HS, Kim HJ. Statin use and incidence and mortal-ity of breast and gynecology cancer: a cohort study using the National Health Insurance claims database. Int J Cancer 2022;150(7):1156-1165. https://doi.org/10.1002/ijc.33869ArticlePubMed
- 16. Austin PC, Xin Yu AY, Vyas MV, Kapral MK. Applying propensity score methods in clinical research in neurology. Neurology 2021;97(18):856-863. https://doi.org/10.1212/WNL.0000000000012777ArticlePubMedPMC
- 17. Park S, Han S, Suh HS. The disease burden of migraine patients receiving prophylactic treatments in Korea: a population-based claims database analysis. BMC Health Serv Res 2022;22(1):902. https://doi.org/10.1186/s12913-022-08191-zArticlePubMedPMC
- 18. Han S, Han S, Suh HS, Bang OY, On YK, Lee MY, et al. Effectiveness and safety of non-vitamin K antagonist oral anticoagulants in patients with non-valvular atrial fibrillation: a nationwide, population-based study in Korea. J Arrhythm 2021;37(5):1240-1249. https://doi.org/10.1002/joa3.12607ArticlePubMedPMC
- 19. Chow R, Lee J, Noh H, Lee J, Simone CB 2nd, Shin HJ, et al. The association between statin and COVID-19 adverse outcomes: national COVID-19 cohort in South Korea. Ann Palliat Med 2022;11(4):1297-1307. https://doi.org/10.21037/apm-21-3464ArticlePubMed
- 20. Song Y, Lee HS, Park G, Kang SW, Lee JW. Dyslipidemia risk in thyroid cancer patients: a nationwide population-based cohort study. Front Endocrinol (Lausanne) 2022;13: 893461. https://doi.org/10.3389/fendo.2022.893461ArticlePubMedPMC
- 21. Yun I, Hurh K, Jeong SH, Park EC, Jang SI. The risk of osteoporotic fractures after gastrectomy: findings from the Korean national sample cohort database (2002-2019). Front Oncol 2022;12: 1014817. https://doi.org/10.3389/fonc.2022.1014817ArticlePubMedPMC
- 22. Kim EH, Lee J, Lee SA, Jung YW. Impact of maternal age on singleton pregnancy outcomes in primiparous women in South Korea. J Clin Med 2022;11(4):969. https://doi.org/10.3390/jcm11040969ArticlePubMedPMC
- 23. Ha EK, Kim JH, Kwak JH, Lee S, Cha HR, Chung EH, et al. Association of clinical and social factors with risk of fracture in children with atopic dermatitis. Pediatr Allergy Immunol 2022;33(2):e13712. https://doi.org/10.1111/pai.13712ArticlePubMed
- 24. Oh TK, Song IA. Weekend admission and mortality among patients with sepsis: a nationwide cohort study in South Korea. Acta Anaesthesiol Scand 2021;65(5):639-647. https://doi.org/10.1111/aas.13786ArticlePubMed
- 25. Biondi-Zoccai G, Romagnoli E, Agostoni P, Capodanno D, Castagno D, D’Ascenzo F, et al. Are propensity scores really superior to standard multivariable analysis? Contemp Clin Trials 2011;32(5):731-740. https://doi.org/10.1016/j.cct.2011.05.006ArticlePubMed
- 26. Amoah J, Stuart EA, Cosgrove SE, Harris AD, Han JH, Lautenbach E, et al. Comparing propensity score methods versus traditional regression analysis for the evaluation of observational data: a case study evaluating the treatment of gram-negative bloodstream infections. Clin Infect Dis 2020;71(9):e497-e505. https://doi.org/10.1093/cid/ciaa169ArticlePubMedPMC
- 27. Nguyen TL, Collins GS, Spence J, Daurès JP, Devereaux PJ, Landais P, et al. Double-adjustment in propensity score matching analysis: choosing a threshold for considering residual imbalance. BMC Med Res Methodol 2017;17(1):78. https://doi.org/10.1186/s12874-017-0338-0ArticlePubMedPMC
- 28. Kim KH. Comorbidity adjustment in health insurance claim database. Health Policy Manag 2016;26(1):71-78. (Korean). http://dx.doi.org/10.4332/KJHPA.2016.26.1.71Article
- 29. Health Insurance Review and Assessment Service (HIRA). Manual for analysis of health insurance claim data to generate health care evidence. Wonju: HIRA; 2018. p. 34-45 (Korean)
- 30. Kim KH, Ahn LS. A comparative study on comorbidity measurements with lookback period using health insurance database: focused on patients who underwent percutaneous coronary intervention. J Prev Med Public Health 2009;42(4):267-273. (Korean). https://doi.org/10.3961/jpmph.2009.42.4.267ArticlePubMed
- 31. Kim KH. Comparative study on three algorithms of the ICD-10 Charlson comorbidity index with myocardial infarction patients. J Prev Med Public Health 2010;43(1):42-49. (Korean). https://doi.org/10.3961/jpmph.2010.43.1.42ArticlePubMed
- 32. Kim J, Choi EY, Lee W, Oh HM, Pyo J, Ock M, et al. Feasibility of capturing adverse events from insurance claims data using International Classification of Diseases, tenth revision, codes coupled to present on admission indicators. J Patient Saf 2022;18(5):404-409. https://doi.org/10.1097/PTS.0000000000000932ArticlePubMed
REFERENCES
Figure & Data
References
Citations
- Worsening of health disparities across COVID-19 pandemic stages in Korea
Hyejin Lee, Hyunwoo Nam, Jae-ryun Lee, Hyemin Jung, Jin Yong Lee
Epidemiology and Health.2024; : e2024038. CrossRef - Trends in Regional Disparities in Cardiovascular Surgery and Mortality in Korea: A National Cross-sectional Study
Dal-Lae Jin, Kyoung-Hoon Kim, Euy Suk Chung, Seok-Jun Yoon
Journal of Preventive Medicine and Public Health.2024; 57(3): 260. CrossRef
 PubReader
 ePub Link
 Cite
Cite

