
Articles
- Page Path
- HOME > J Prev Med Public Health > Volume 53(4); 2020 > Article
-
Original Article
Comparison of Computed Tomography-based Abdominal Adiposity Indexes as Predictors of Non-alcoholic Fatty Liver Disease Among Middle-aged Korean Men and Women -
Jongmin Baek1,2
 , Sun Jae Jung1,2, Jee-Seon Shim1, Yong Woo Jeon1,2, Eunsun Seo1, Hyeon Chang Kim1,2
 -
Journal of Preventive Medicine and Public Health 2020;53(4):256-265.
DOI: https://doi.org/10.3961/jpmph.20.140
Published online: June 18, 2020
1Department of Preventive Medicine, Yonsei University College of Medicine, Seoul, Korea
2Department of Public Health, Yonsei University Graduate School, Seoul, Korea
- Corresponding author: Hyeon Chang Kim, MD, PhD Department of Preventive Medicine, Yonsei University College of Medicine, 50-1 Yonsei-ro, Seodaemun-gu, Seoul 03722, Korea E-mail: hckim@yuhs.ac
Copyright © 2020 The Korean Society for Preventive Medicine
This is an Open Access article distributed under the terms of the Creative Commons Attribution Non-Commercial License (http://creativecommons.org/licenses/by-nc/4.0/) which permits unrestricted non-commercial use, distribution, and reproduction in any medium, provided the original work is properly cited.
ABSTRACT
-
Objectives:
- We compared the associations of 3 computed tomography (CT)-based abdominal adiposity indexes with non-alcoholic fatty liver disease (NAFLD) among middle-aged Korean men and women.
-
Methods:
- The participants were 1366 men and 2480 women community-dwellers aged 30-64 years. Three abdominal adiposity indexes—visceral fat area (VFA), subcutaneous fat area (SFA), and visceral-to-subcutaneous fat ratio (VSR)—were calculated from abdominal CT scans. NAFLD was determined by calculating the Liver Fat Score from comorbidities and blood tests. An NAFLD prediction model that included waist circumference (WC) as a measure of abdominal adiposity was designated as the base model, to which VFA, SFA, and VSR were added in turn. The area under the receiver operating characteristic curve (AUC), integrated discrimination improvement (IDI), and net reclassification improvement (NRI) were calculated to quantify the additional predictive value of VFA, SFA, and VSR relative to WC.
-
Results:
- VFA and VSR were positively associated with NAFLD in both genders. SFA was not significantly associated with NAFLD in men, but it was negatively associated in women. When VFA, SFA, and VSR were added to the WC-based NAFLD prediction model, the AUC improved by 0.013 (p<0.001), 0.001 (p=0.434), and 0.009 (p=0.007) in men and by 0.044 (p<0.001), 0.017 (p<0.001), and 0.046 (p<0.001) in women, respectively. The IDI and NRI were increased the most by VFA in men and VSR in women.
-
Conclusions:
- Using CT-based abdominal adiposity indexes in addition to WC may improve the detection of NAFLD. The best predictive indicators were VFA in men and VSR in women.
- Keywords: Abdominal fat, Visceral-to-subcutaneous fat ratio, Intra-abdominal fat, Subcutaneous fat, Fatty liver, Non-alcoholic fatty liver disease
- Non-alcoholic fatty liver disease (NAFLD) is an increasingly common liver disease with an estimated prevalence of 20-30% [1]. NAFLD can increase the risk of overall and liver-related mortality and is also considered a feature of cardiometabolic syndrome [2]. Thus, the early detection of NAFLD and the identification of people at risk of developing the disease are important public health issues.
- The quantity of abdominal fat is closely associated with NAFLD [3]. Waist circumference (WC) is the most commonly used measure of abdominal adiposity. Although WC is a good general indicator of the total amount of abdominal fat, it does not distinguish between visceral fat and subcutaneous fat, which may have different relationships with metabolic diseases. NAFLD is associated with an increase in visceral fat and a decrease in subcutaneous fat even at identical WC measurements [4-9]. Since many studies have reported that visceral fat is a greater contributor to NAFLD development than subcutaneous fat, measurements of the amount of visceral fat in absolute terms or relative to subcutaneous fat have been suggested as indicators of abnormal abdominal fat presence [10-14].
- However, few community-based studies have examined the discriminatory power of these abdominal adiposity indexes [15], and studies that compare men and women in this regard are also lacking. For these reasons, we compared 3 computed tomography (CT)-based abdominal adiposity indexes with regard to the prediction of NAFLD to determine the index with the best discriminatory power in a middle-aged population of Korean men and women.
INTRODUCTION
- Study Population
- The present study used baseline data from the Cardiovascular and Metabolic Diseases Etiology Research Center (CMERC) cohort, which consisted of community-dwelling adults aged 30 years to 64 years in the vicinity of the capital city of Korea [16]. The exclusion criteria for cohort participants were diagnosis with cancer within the past 2 years or current treatment for cancer; history of myocardial infarction, stroke, or heart failure; current participation in any clinical drug trials; and current pregnancy [16]. The cohort study initially enrolled 8097 participants at 2 research clinics between 2013 and 2018. Quantitative computed tomography (QCT) images were available for only 4060 participants, because only 1 clinic of the 2 clinics used QCT to measure body fat distribution, while the other used dual-energy x-ray absorptiometry. We also excluded 214 participants who had been diagnosed with liver cirrhosis or chronic hepatitis, who consumed excessive quantities of alcohol (>7 drink/wk for women and >14 drink/wk for men) [17], or for whom key variables were missing. After exclusion, 3846 participants (1366 men and 2480 women) were eligible for the current analysis.
- Measurements
- Patients were directly asked about health behaviors and personal disease history by trained interviewers using standardized questionnaires according to a predetermined protocol [16]. Cigarette smoking and alcohol intake status were dichotomized to current smokers versus past or never smokers and current drinkers versus past or never drinkers. Participants rested for at least 5 minutes in a seated position before blood pressure (BP) measurements were taken. Trained research personnel took BP measurements using an automated oscillometric device (HEM-7080; Omron Healthcare, Kyoto, Japan). Systolic blood pressure (SBP) and diastolic blood pressure (DBP) was measured 3 times each at 2-minute intervals on the right arm [16]. The average of the last 2 measurements was used in the analysis. Standing height was measured to the nearest 0.1 cm using a stadiometer (DS-102; Dong Sahn Jenix, Seoul, Korea), and body weight was measured to the nearest 0.1 kg on a digital scale (DB-150; CAS, Seoul, Korea) according to the predetermined protocol [16]. Body mass index (BMI) was calculated as the body weight divided by the standing height squared (kg/m2). WC was measured at the midpoint between the lower border of the rib cage and the iliac crest using standards recommended by the World Health Organization and the International Diabetes Federation [16]. Visceral fat area (VFA), subcutaneous fat area (SFA), and their ratio, the visceral-tosubcutaneous fat ratio (VSR), were calculated from the QCT images at the level of the L4-5 intervertebral space. For these measurements, subjects were in the supine position, as total body fat volume is best predicted with the person in this position. The QCT scan protocol included a peak kilovoltage of 120 kVp, a current of 150 mA, a pitch of 1.0, and a slice thickness of 3 mm (phantom model 3). Each tissue area was measured with an Aquarius iNtuition Viewer (version 4.4.12; TeraRecon, Foster City, CA, USA), which was used to determine the fat area by setting the attenuation values for the region of interest within a range of −190 Hounsfield to −30 Hounsfield units [16].
- Disease Definitions
- Many diagnostic methods are used to screen for NAFLD in asymptomatic individuals, but no consensus exists regarding which is best. In the diagnosis of NAFLD, CT is known to have high specificity in assessing the amount of liver fat, but it has relatively low sensitivity [18,19]. In this study, we used the NAFLD Liver Fat Score (NAFLD-LFS) because it is the most validated and reported diagnostic model available for NAFLD [20]. The NAFLD-LFS is a function that was developed using proton magnetic resonance spectroscopy in 470 Finnish patients and that uses predictive variables such as the presence of metabolic syndrome, the presence of type 2 diabetes, and fasting serum insulin, aspartate transaminase (AST), and alanine transaminase (ALT) levels [21]. The formula employed after multivariate logistic and linear regression analyses was: NAFLD-LFS=−2.89+1.18×metabolic syndrome (yes=1/no=0)+0.45× diabetes (yes=2/no=0)+0.15×fasting insulin (mU/L)+0.04× AST (IU/L)–0.94×AST/ALT ratio. The presence of 3 or more of the following criteria constituted a diagnosis of metabolic syndrome: WC ≥90 cm in men or ≥85 cm in women, triglycerides (TG) ≥150 mg/dL, high-density lipoprotein (HDL) cholesterol <40 mg/dL in men or <50 mg/dL in women, BP ≥130/85 mmHg or current antihypertensive medication use, and fasting glucose ≥100 mg/dL or current use of an oral hypoglycemic agent or insulin. The optimal cut-off value for NAFLD was set at −0.640 (sensitivity, 86%; specificity, 71%), meaning that NAFLD could be ruled out or diagnosed in patients who scored below and above that level, respectively [21]. To conduct a sensitivity analysis, we also used other NAFLD scores, such as the Fatty Liver Index (FLI) and the Framingham Steatosis Index (FSI), to determine the presence of NAFLD. The FLI, which is an algorithm based on WC, BMI, and levels of TG and gamma-glutamyl transferase, was devised using ultrasonography in 496 Italian patients. The cut-off value for NAFLD was set at 60 [22]. The FSI was designed based on a cross-sectional study of 1181 members of the Framingham Third Generation Cohort, and the cutoff value for NAFLD was set at 23 [23].
- Additionally, hypertension was defined as SBP/DBP ≥140/90 mmHg or current use of antihypertensive medication. Diabetes mellitus was defined as fasting plasma glucose ≥126 mg/dL, hemoglobin A1c ≥6.5%, or current use of an oral hypoglycemic agent or insulin.
- Statistical Analysis
- All analyses were conducted separately for men and women due to the substantial sex difference with regard to body composition. The chi-square test, the Mantel-Haenszel chi-square test, and the Student t-test were used to evaluate differences in characteristics between people with and without NAFLD. The p-for trend was calculated by including an independent variable (quartiles) as a single continuous variable instead of multiple categorical variables. Multiple logistic regression models were used to evaluate the associations between the abdominal adiposity indexes and NAFLD, and the results were expressed as odds ratios and 95% confidence intervals. Age, drinking status, smoking status, hypertension, diabetes mellitus, and BMI were adjusted for in the models in which WC was evaluated. In addition to the abovementioned variables, we additionally adjusted for WC in the VFA, SFA, and VSR-evaluating models [18]. VFA, SFA, and VSR were analyzed both as continuous variables and quartile-based categorical variables. Lastly, we calculated the area under the receiver operating characteristic curve (AUC), the integrated discrimination improvement (IDI), and the net reclassification improvement (NRI) to quantify incremental predictive ability when adding the indexes of VFA, SFA, or VSR to the models that already included WC [24]. The WC-based model included only WC for the assessment of abdominal adiposity. Regarding NRI, we calculated both category-based and category-free NRI. We determined the categorybased NRI by defining 2 different sets of 3 categories (<10%, 10-20%, or >20% and <20%, 20-50%, or >50%). However, since the results were similar in both cases, we presented only 1 set of NRI values based on 20% and 50% cut-offs. All analyses were performed with SAS version 9.4 (SAS Institute Inc., Cary, NC, USA), and p-values <0.05 were considered to indicate statistical significance.
- Ethics Statement
- The study protocol was approved by the Institutional Review Board of the Yonsei University College of Medicine (4-2013- 0661).
METHODS
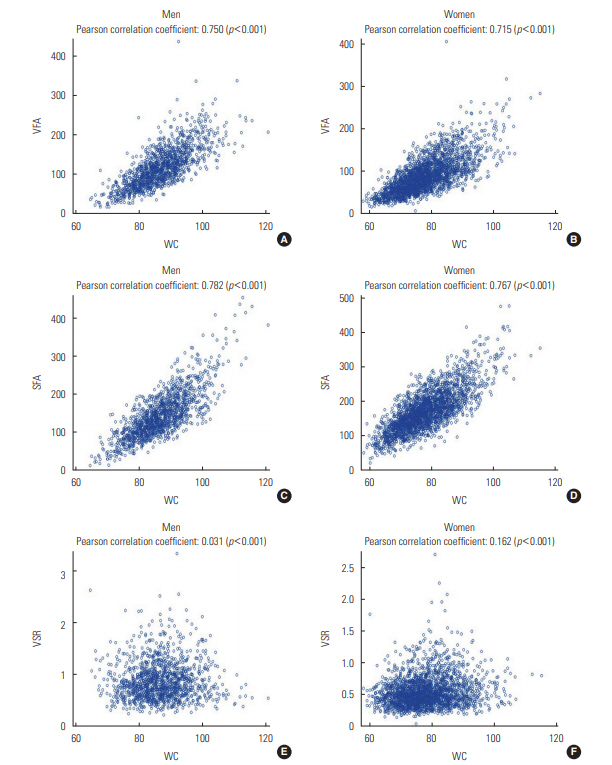
- Table 1 presents the characteristics of the men and women participants depending on the presence or absence of NAFLD. Men with NAFLD were more likely to smoke cigarettes and to have hypertension and diabetes than men without the condition. In contrast, women with NAFLD were older and had a higher prevalence of hypertension and diabetes, but a lower rate of smoking and alcohol drinking than those without NAFLD. All 3 CT-based abdominal adiposity indexes, as well as WC, were higher among people with NAFLD than among those without the disease. Figure 1 presents correlations between WC and the 3 CT-based indexes for men and women separately. VFA and SFA showed strong positive correlations with WC in both men and women (r=0.715 to 0.782; p<0.001). However, VSR was found to be independent of WC in men (r=0.031; p=0.252) and was only weakly correlated with WC in women (r=0.162; p<0.001).
- Table 2 and Supplemental Material 1 show the association between each abdominal adiposity index and NAFLD after adjusting for age, drinking status, smoking status, hypertension, diabetes mellitus, BMI, and WC. VFA and VSR were positively associated with NAFLD in men, while SFA was not significantly associated with NAFLD in men. In women, VFA and VSR were positively associated with NAFLD, while SFA was negatively associated with NAFLD. For the sensitivity analysis, we repeated the same process but replaced the LFS measurement with FLI or FSI. The results were quite similar to those obtained using LFS, and the data are presented in Supplemental Materials 2 and 3.
- Table 3 summarizes numerical indicators of the extent to which the NAFLD risk assessment improved with the addition of the CT-based indexes to the WC-based model. Increases in AUC, IDI, category-based NRI, and category-free NRI were observed when each CT-based index was added to the WC-based model. In men, statistically significant improvements were observed in all indicators when VFA or VSR was added to the WC-based model. However, the addition of VFA led to greater improvements than the addition of VSR, which was calculated from VFA and SFA. In women, the addition of VFA, SFA, and VSR each led to statistically significant improvements in all 4 indicators. However, the addition of VSR led to greater improvements than that of either VFA and SFA.
- To visualize the changes that occurred upon addition of the CT indexes, we drew scatter plots of estimated NAFLD probability in the CT index-added models versus the WC-based model. We did this separately in the NAFLD-present and the NAFLD-absent groups (Supplemental Material 4). In men, the addition of the SFA index made little change to the NAFLD probabilities in both groups. On the contrary, the addition of VFA or VSR resulted in a higher probability of NAFLD diagnosis (indicated by dots above the diagonal line) for some participants in the NAFLD-present group. In women, the addition of all 3 CT indexes led to higher probabilities (indicated by dots above the diagonal line) of NAFLD diagnosis in the NAFLD-present group and lower probabilities (indicated by dots below the diagonal line) of diagnosis in the NAFLD-absent group (Supplemental Material 4).
- As a further analysis, we assessed the NAFLD predictive capacity of the CT-based abdominal adiposity indexes in 3 separate groups that were divided by BMI, an index of general obesity. In men, the CT-based indexes produced significant improvements in the overweight (BMI 23.0-24.9 kg/m2) and obese (BMI ≥25.0 kg/m2) groups, but not in the normal-BMI group (<23.0 kg/m2). However, in women, the addition of the CT-based indexes resulted in significant improvements to all BMI groups, with data presented in Supplemental Material 5.
RESULTS
- In this study of healthy middle-aged men and women, the addition of a CT-based abdominal adiposity index was found to better distinguish the probable presence of NAFLD than the use of WC alone. Among the 3 CT-based indexes studied, VFA and VSR, when added to the model, showed the best improved discriminatory power in men and women, respectively.
- Previous studies have evaluated the associations of the absolute or relative amounts of visceral and subcutaneous fat with NAFLD. A 4-year follow-up study of a total of 2017 adults reported that a larger amount of visceral fat was longitudinally associated with a higher risk of incident NAFLD, and a larger amount of subcutaneous fat was longitudinally associated with the regression of NAFLD [4]. In another cross-sectional study of 408 adults, a larger amount of femoral subcutaneous fat was negatively associated with NAFLD in women, but not in men [25].
- VSR can be a useful index to identify individuals at risk of cardiovascular disease [7,8] and metabolic syndrome [15]. Higher VSR, as assessed by a dual bioelectrical impedance analyzer, has been found to be associated with cardiovascular events in patients with type 2 diabetes who regularly visited the university hospital in Tokyo, Japan [7]. In a cross-sectional study of 535 adults, VSR showed superior AUC values in predicting at least 2 non-adipose factors for metabolic syndrome (hyperglycemia, high BP, high TG, and low HDL cholesterol) in men with a normal WC [15]. In the present study, we compared the NAFLD predictive value of CT-based abdominal adiposity indexes and used not only AUC, but also IDI and NRI for the comparison of the discriminatory power.
- In this study, as shown in Table 2, the results varied not only by type of fat, but also by gender. In women, subcutaneous fat was found to be negatively associated with NAFLD. In men, however, subcutaneous fat was not associated with NAFLD. Previous studies have shown differences between visceral and subcutaneous fat with regard to the associated pathologies and physiologies [3,26]. Venous drainage from subcutaneous fat is directed into the systemic circulation, whereas venous drainage from visceral fat is routed into the portal vein. Thus, the metabolic products of visceral fat reach the liver directly and exercise a first-pass effect on liver metabolism. It has been hypothesized that visceral fat releases free fatty acids and adipokines and thereby exposes the liver to fat accumulation [3- 5,10,13,21], whereas subcutaneous fat could act as a possible ‘metabolic sink’ for metabolic diseases, including NAFLD [4]. Additionally, the type and function of fat deposits differ by gender. Men tend to store more visceral fat, whereas women are more likely to store subcutaneous fat before menopause and visceral fat after menopause. It is well recognized that sex hormones contribute to this regulation [27]. Estrogen plays an important role in regulating metabolism and lipogenesis [8]. In this study, the role of subcutaneous fat as a metabolic sink appeared to be different in men and women. In order to analyze visceral fat and subcutaneous fat separately as mentioned above, image-based indicators should be used in future studies. This will facilitate the creation of a composite abdominal adiposity index, such as VSR.
- The mechanisms governing body fat distribution remain largely unknown, although age, gender, stress, smoking, a lack of physical activity, and endocrine and genetic factors have been shown to have a significant impact [9,11,21,28-30]. Fat distribution could therefore be interpreted as a marker that explain the physiological status of the human body. The lipid overflow ectopic fat model suggests that surplus energy is physiologically stored primarily in subcutaneous fat, which acts as a metabolic sink for circulating non-esterified fatty acids. However, when this depot is dysfunctional, energy can alternatively be deposited in visceral fat [6]. The failure of adipocyte proliferation and differentiation has been discussed as a possible mechanism of functional subcutaneous fat insufficiency. The relatively greater quantity of visceral fat may then cause hepatic insulin resistance by releasing a variety of biologically active molecules, such as non-esterified fatty acids and inflammatory mediators, into the portal vein system (the ‘portal vein hypothesis’), resulting in NAFLD [6]. In this study, VSR, which could be interpreted as relative body fat distribution, was found to be positively associated with NAFLD in men and women. VSR was nearly independent of WC and was associated with different findings than the absolute measures of fat, such as VFA and SFA, as shown in Figure 1.
- In women, VSR was shown to be a better predictor of NAFLD than VFA. Because SFA was not associated with NAFLD and had no role as a metabolic sink in men, the relative distribution of VFA and SFA had no specific meaning. Thus, it can be concluded that VFA is more important than VSR in men. However, in women, the opposite associations of VFA and SFA with NAFLD were found. Thus, VSR, which indicates one’s personal pattern of fat distribution, may be more meaningful than the absolute amount of fat in the discrimination of NAFLD in women. The strength of association and the discriminatory power were different parts in understanding the relationships between abdominal adiposity indexes and NAFLD.
- In the current study, improvements in discrimination as assessed through IDI and NRI were evident, but the increase in the AUC was relatively small. As in many other studies, the use of the AUC was limited because this measure is not sensitive to model comparisons if the reference model performs well, particularly if it is greater than 0.8.
- In men, VFA was the abdominal adiposity index that was the best predictor of NAFLD in all BMI subgroups. In contrast, a difference was observed in the BMI subgroups among women. In women with normal BMI, the addition of VFA conferred the greatest improvement in AUC. However, in overweight and obese women, the addition of VSR led to the greatest improvement in AUC. As mentioned regarding the hypothesis that subcutaneous fat has an opposite association with NAFLD, it could be interpreted that VSR would be meaningful only if one assumes that a certain amount of subcutaneous fat acting as a metabolic sink is present. However, further studies are needed.
- The current study had some limitations. First, we could not confirm the presence or absence of NAFLD via liver pathology, which is considered the gold standard for NAFLD diagnosis. Liver biopsy is almost impossible to use for screening for liver diseases in asymptomatic individuals, so most epidemiological studies use imaging or biochemical tests to assess the presence of NAFLD. Thus, we used NAFLD-LFS, a common composite variable of determining NAFLD, and applied other 2 methods as a sensitivity analysis. The positive and negative predictive values of LFS must be studied further in the Korean population. Second, the participants were middle-aged adults residing in the area of Korea’s capital; therefore, these results cannot be generalized to the entire Korean adult population. Third, this study was cross-sectional in nature, so we could only predict the probability of currently having NAFLD and could not determine whether abdominal adiposity indexes can predict the onset or progression of NAFLD.
- The results of the current study suggest that measuring the absolute or relative amounts of visceral and subcutaneous fat in the abdomen, using CT images, can aid in the detection of individuals with probable fatty liver disease. Among the 3 indexes studied, VFA and VSR yielded the greatest improvement in discriminatory power when added to the WC-based model in men and women, respectively.
DISCUSSION
SUPPLEMENTAL MATERIALS
Supplement Material 1.
Supplemental Material 2.
Supplemental Material 3.
Supplement Material 4.
Supplemental Material 5.
-
CONFLICT OF INTEREST
The authors have no conflicts of interest associated with the material presented in this paper.
-
FUNDING
This study was supported by a grant (HI13C0715) from the Korea Health Technology R&D Project, funded by the Ministry of Health and Welfare of the Republic of Korea.
Notes
ACKNOWLEDGEMENTS
-
AUTHOR CONTRIBUTIONS
Conceptualization: JB, HCK. Data curation: JB, HCK, JSS, YWJ. Formal analysis: JB, HCK. Funding acquisition: HCK. Methodology: JB, HCK, SJJ, JSS, YWJ. Visualization: JB, HCK, ES. Writing - original draft: JB, HCK. Writing - review & editing: SJJ, JSS, YWJ, ES.
Notes
| Abdominal adiposity index |
Men (n=1366) |
Women (n=2480) |
|||||||
|---|---|---|---|---|---|---|---|---|---|
| Range | n | n (%) of NAFLD | OR (95% CI)1 | Range | n | n (%) of NAFLD | OR (95% CI)1 | ||
| VFA | |||||||||
| Q1 | <82.3 | 341 | 15 (4.4) | 1.00 (reference) | <59.6 | 620 | 6 (1.0) | 1.00 (reference) | |
| Q2 | 82.3-111.8 | 342 | 67 (19.6) | 2.59 (1.36, 4.95) | 59.6-83.3 | 620 | 28 (4.5) | 2.99 (1.19, 7.51) | |
| Q3 | 111.9-146.4 | 340 | 141 (41.5) | 4.73 (2.45, 9.16) | 83.4-110.0 | 620 | 78 (12.6) | 6.65 (2.72, 16.23) | |
| Q4 | ≥146.5 | 343 | 222 (64.7) | 6.14 (2.96, 12.73) | ≥110.1 | 620 | 266 (42.9) | 17.84 (7.12, 44.71) | |
| p for trend | <0.001 | <0.001 | |||||||
| continuous (per 10 cm2) | 1.13 (1.07, 1.18) | 1.26 (1.20, 1.32) | |||||||
| SFA | |||||||||
| Q1 | <105.2 | 341 | 28 (8.2) | 1.00 (reference) | <131.4 | 620 | 44 (7.1) | 1.00 (reference) | |
| Q2 | 105.2-135.9 | 342 | 78 (22.8) | 1.37 (0.79, 2.38) | 131.4-164.3 | 620 | 66 (10.7) | 0.54 (0.34, 0.88) | |
| Q3 | 136.0-174.9 | 341 | 139 (40.8) | 1.66 (0.93, 2.97) | 164.4-203.9 | 620 | 108 (17.4) | 0.50 (0.31, 0.81) | |
| Q4 | ≥175.0 | 342 | 200 (58.5) | 1.26 (0.64, 2.48) | ≥204.0 | 620 | 160 (25.8) | 0.21 (0.12, 0.38) | |
| p for trend | 0.592 | <0.001 | |||||||
| continuous (per 10 cm2) | 0.99 (0.94, 1.04) | 0.89 (0.86, 0.92) | |||||||
| VSR | |||||||||
| Q1 | <0.61 | 341 | 98 (28.7) | 1.00 (reference) | <0.39 | 620 | 33 (5.3) | 1.00 (reference) | |
| Q2 | 0.61-0.79 | 342 | 103 (30.1) | 1.39 (0.88, 2.20) | 0.39-0.48 | 620 | 53 (8.6) | 1.39 (0.81, 2.38) | |
| Q3 | 0.80-1.03 | 341 | 115 (33.7) | 1.91 (1.20, 3.03) | 0.49-0.64 | 620 | 88 (14.2) | 3.06 (1.83, 5.12) | |
| Q4 | ≥1.04 | 342 | 129 (37.7) | 1.99 (1.22, 3.26) | ≥0.65 | 620 | 204 (32.9) | 6.73 (4.10, 11.03) | |
| p for trend | 0.003 | <0.001 | |||||||
| continuous (per 0.1 SD) | 1.03 (1.01, 1.05) | 1.07 (1.06, 1.09) | |||||||
NAFLD, non-alcoholic fatty liver disease; OR, odds ratio; CI, confidence interval; VFA, visceral fat area; SFA, subcutaneous fat area; VSR, visceral-to-subcutaneous fat ratio.
1 Adjusted for age, drinking status, smoking status, hypertension, diabetes mellitus, body mass index, and waist circumference.
| Abdominal adiposity index |
AUC |
Improved AUC |
IDI |
Category-based NRI1 |
Category-free NRI |
|||||
|---|---|---|---|---|---|---|---|---|---|---|
| Index | Index | p-value | Index | p-value | Index | p-value | Index | p-value | ||
| Men | ||||||||||
| Base model2 | 0.813 | |||||||||
| WC3 | 0.842 | Reference | Reference | Reference | Reference | |||||
| WC+VFA | 0.855 | 0.013 | <0.001 | 0.024 | <0.001 | 0.050 | 0.018 | 0.296 | <0.001 | |
| WC+SFA | 0.843 | 0.001 | 0.434 | 0.002 | 0.160 | △0.002 | 0.835 | 0.074 | 0.201 | |
| WC+VSR | 0.851 | 0.009 | 0.007 | 0.017 | <0.001 | 0.050 | 0.012 | 0.262 | <0.001 | |
| Women | ||||||||||
| Base model2 | 0.807 | |||||||||
| WC3 | 0.818 | Reference | Reference | Reference | Reference | |||||
| WC+VFA | 0.862 | 0.044 | <0.001 | 0.075 | <0.001 | 0.181 | <0.001 | 0.620 | <0.001 | |
| WC+SFA | 0.836 | 0.017 | <0.001 | 0.040 | <0.001 | 0.113 | <0.001 | 0.412 | <0.001 | |
| WC+VSR | 0.865 | 0.046 | <0.001 | 0.089 | <0.001 | 0.207 | <0.001 | 0.654 | <0.001 | |
NAFLD, non-alcoholic fatty liver disease; AUC, area under the receiver operating characteristic curve; IDI, integrated discrimination improvement; NRI, net reclassification improvement; WC, waist circumference; VFA, visceral fat area; SFA, subcutaneous fat area; VSR, visceral-to-subcutaneous fat ratio; △, negative number.
1 For the category-based NRI, risk cut-offs of 20% and 50% were used.
2 The base model is adjusted for age and body mass index.
3 The WC-based model is adjusted for age, body mass index, and WC.
- 1. Stepanova M, Rafiq N, Makhlouf H, Agrawal R, Kaur I, Younoszai Z, et al. Predictors of all-cause mortality and liver-related mortality in patients with non-alcoholic fatty liver disease (NAFLD). Dig Dis Sci 2013;58(10):3017-3023ArticlePubMedPDF
- 2. Paik JM, Henry L, De Avila L, Younossi E, Racila A, Younossi ZM. Mortality related to nonalcoholic fatty liver disease is increasing in the United States. Hepatol Commun 2019;3(11):1459-1471ArticlePubMedPMC
- 3. Jakobsen MU, Berentzen T, Sørensen TI, Overvad K. Abdominal obesity and fatty liver. Epidemiol Rev 2007;29(1):77-87ArticlePubMedPDF
- 4. Kim D, Chung GE, Kwak MS, Seo HB, Kang JH, Kim W, et al. Body fat distribution and risk of incident and regressed nonalcoholic fatty liver disease. Clin Gastroenterol Hepatol 2016;14(1):132-138ArticlePubMed
- 5. Radmard AR, Rahmanian MS, Abrishami A, Yoonessi A, Kooraki S, Dadgostar M, et al. Assessment of abdominal fat distribution in non-alcoholic fatty liver disease by magnetic resonance imaging: a population-based study. Arch Iran Med 2016;19(10):693-699PubMed
- 6. Després JP. Body fat distribution and risk of cardiovascular disease: an update. Circulation 2012;126(10):1301-1313ArticlePubMed
- 7. Fukuda T, Bouchi R, Takeuchi T, Nakano Y, Murakami M, Minami I, et al. Ratio of visceral-to-subcutaneous fat area predicts cardiovascular events in patients with type 2 diabetes. J Diabetes Investig 2018;9(2):396-402ArticlePubMed
- 8. Kaess BM, Pedley A, Massaro JM, Murabito J, Hoffmann U, Fox CS. The ratio of visceral to subcutaneous fat, a metric of body fat distribution, is a unique correlate of cardiometabolic risk. Diabetologia 2012;55(10):2622-2630ArticlePubMedPMCPDF
- 9. Piché ME, Poirier P, Lemieux I, Després JP. Overview of epidemiology and contribution of obesity and body fat distribution to cardiovascular disease: an update. Prog Cardiovasc Dis 2018;61(2):103-113ArticlePubMed
- 10. Eguchi Y, Eguchi T, Mizuta T, Ide Y, Yasutake T, Iwakiri R, et al. Visceral fat accumulation and insulin resistance are important factors in nonalcoholic fatty liver disease. J Gastroenterol 2006;41(5):462-469ArticlePubMedPDF
- 11. Holt HB, Wild SH, Wood PJ, Zhang J, Darekar AA, Dewbury K, et al. Non-esterified fatty acid concentrations are independently associated with hepatic steatosis in obese subjects. Diabetologia 2006;49(1):141-148ArticlePubMedPDF
- 12. Thomas EL, Hamilton G, Patel N, O’Dwyer R, Doré CJ, Goldin RD, et al. Hepatic triglyceride content and its relation to body adiposity: a magnetic resonance imaging and proton magnetic resonance spectroscopy study. Gut 2005;54(1):122-127ArticlePubMedPMC
- 13. Park BJ, Kim YJ, Kim DH, Kim W, Jung YJ, Yoon JH, et al. Visceral adipose tissue area is an independent risk factor for hepatic steatosis. J Gastroenterol Hepatol 2008;23(6):900-907ArticlePubMed
- 14. van der Poorten D, Milner KL, Hui J, Hodge A, Trenell MI, Kench JG, et al. Visceral fat: a key mediator of steatohepatitis in metabolic liver disease. Hepatology 2008;48(2):449-457ArticlePubMed
- 15. Oh YH, Moon JH, Kim HJ, Kong MH. Visceral-to-subcutaneous fat ratio as a predictor of the multiple metabolic risk factors for subjects with normal waist circumference in Korea. Diabetes Metab Syndr Obes 2017;10: 505-511ArticlePubMedPMC
- 16. Shim JS, Song BM, Lee JH, Lee SW, Park JH, Choi DP, et al. Cardiovascular and Metabolic Diseases Etiology Research Center (CMERC) cohort: study protocol and results of the first 3 years of enrollment. Epidemiol Health 2017;39: e2017016ArticlePubMedPMCPDF
- 17. Zeb I, Li D, Nasir K, Katz R, Larijani VN, Budoff MJ. Computed tomography scans in the evaluation of fatty liver disease in a population based study: the multi-ethnic study of atherosclerosis. Acad Radiol 2012;19(7):811-818ArticlePubMedPMC
- 18. Korean Association for the Study of the Liver. Guidelines for diagnosis of non-alcoholic fatty liver disease. 2013 [cited 2020 Jul 20]. Available from: https://kasl.org/bbs/index.html?code=guide&category=&gubun=&idx=&page=1&number=51&mode=view&order=&sort=&keyfield=&key= (Korean)
- 19. Loria P, Adinolfi LE, Bellentani S, Bugianesi E, Grieco A, Fargion S, et al. Practice guidelines for the diagnosis and management of nonalcoholic fatty liver disease. A decalogue from the Italian Association for the Study of the Liver (AISF) Expert Committee. Dig Liver Dis 2010;42(4):272-282ArticlePubMed
- 20. Lee YH. Diagnosis of non-alcoholic fatty liver disease based on clinical and laboratory data. J Korean Diabetes 2017;18(2):102-108. (Korean)Article
- 21. Kotronen A, Peltonen M, Hakkarainen A, Sevastianova K, Bergholm R, Johansson LM, et al. Prediction of non-alcoholic fatty liver disease and liver fat using metabolic and genetic factors. Gastroenterology 2009;137(3):865-872ArticlePubMed
- 22. Bedogni G, Bellentani S, Miglioli L, Masutti F, Passalacqua M, Castiglione A, et al. The Fatty Liver Index: a simple and accurate predictor of hepatic steatosis in the general population. BMC Gastroenterol 2006;6: 33ArticlePubMedPMCPDF
- 23. Long MT, Pedley A, Colantonio LD, Massaro JM, Hoffmann U, Muntner P, et al. Development and validation of the Framingham steatosis index to identify persons with hepatic steatosis. Clin Gastroenterol Hepatol 2016;14(8):1172-1180ArticlePubMedPMC
- 24. GitHub. GitHub. SAS_Macros/NRI and IDI index.sas. [cited 2020 Apr 1]. Available from: https://github.com/drkrisrogers/SAS_Macros/blob/master/NRI%20and%20IDI%20index.sas
- 25. Jun DW, Han JH, Kim SH, Jang EC, Kim NI, Lee JS, et al. Association between low thigh fat and non-alcoholic fatty liver disease. J Gastroenterol Hepatol 2008;23(6):888-893ArticlePubMed
- 26. Tchernof A, Després JP. Pathophysiology of human visceral obesity: an update. Physiol Rev 2013;93(1):359-404ArticlePubMed
- 27. Wang T, Ma X, Peng D, Zhang R, Sun X, Chen M, et al. Effects of obesity related genetic variations on visceral and subcutaneous fat distribution in a Chinese population. Sci Rep 2016;6: 20691ArticlePubMedPMCPDF
- 28. Malis C, Rasmussen EL, Poulsen P, Petersen I, Christensen K, Beck-Nielsen H, et al. Total and regional fat distribution is strongly influenced by genetic factors in young and elderly twins. Obes Res 2005;13(12):2139-2145ArticlePubMed
- 29. Wells JC. Sexual dimorphism of body composition. Best Pract Res Clin Endocrinol Metab 2007;21(3):415-430ArticlePubMed
- 30. Karpe F, Pinnick KE. Biology of upper-body and lower-body adipose tissue--link to whole-body phenotypes. Nat Rev Endocrinol 2015;11(2):90-100ArticlePubMedPDF
REFERENCES
Figure & Data
References
Citations
- Relationship between Non-Alcoholic Fatty Liver Disease and Visceral Fat Measured by Imaging-Based Body Composition Analysis: A Systematic Review
Ker Ming Seaw, Christiani Jeyakumar Henry, Xinyan Bi
Livers.2023; 3(3): 463. CrossRef - Stratifying the risk of ovarian cancer incidence by histologic subtypes in the Korean Epithelial Ovarian Cancer Study (Ko‐EVE)
Soseul Sung, Youjin Hong, Byoung‐Gie Kim, Ji‐Yeob Choi, Jae Weon Kim, Sang‐Yoon Park, Jae‐Hoon Kim, Yong‐man Kim, Jong‐Min Lee, Tae Jin Kim, Sue K. Park
Cancer Medicine.2023; 12(7): 8742. CrossRef - Correlation between CT Abdominal Anthropometric Measurements and Liver Density in Individuals with Non-Alcoholic Fatty Liver Disease
Dragoș Constantin Cucoranu, Marian Pop, Raluca Niculescu, Vlad Vunvulea, Irina-Bianca Kosovski, Radu-Ovidiu Togănel, Eliza Russu, Adrian Vasile Mureșan, Răzvan-Andrei Licu, Anca Bacârea
Medicina.2023; 59(3): 500. CrossRef
 PubReader
 ePub Link
 Cite
Cite

