Articles
- Page Path
- HOME > J Prev Med Public Health > Volume 52(4); 2019 > Article
-
Original Article
Measuring and decomposing socioeconomic inequality in catastrophic healthcare expenditures in Iran -
Satar Rezaei1
 , Mohammad Hajizadeh2
 -
Journal of Preventive Medicine and Public Health 2019;52(4):214-223.
DOI: https://doi.org/10.3961/jpmph.19.046
Published online: June 14, 2019
1Research Center for Environmental Determinants of Health, Health Institute, Kermanshah University of Medical Sciences, Kermanshah, Iran
2School of Health Administration, Faculty of Health, Dalhousie University, Halifax, NS, Canada
- Corresponding author: Satar Rezaei, PhD Research Center for Environmental Determinants of Health, Health Institute, Kermanshah University of Medical Sciences, Isar Square, Kermanshah 6719851351, Iran E-mail: satarrezaei@gmail.com
Copyright © 2019 The Korean Society for Preventive Medicine
This is an Open Access article distributed under the terms of the Creative Commons Attribution Non-Commercial License (http://creativecommons.org/licenses/by-nc/4.0/) which permits unrestricted non-commercial use, distribution, and reproduction in any medium, provided the original work is properly cited.
ABSTRACT
-
Objectives
- Equity in financial protection against healthcare expenditures is one the primary functions of health systems worldwide. This study aimed to quantify socioeconomic inequality in facing catastrophic healthcare expenditures (CHE) and to identify the main factors contributing to socioeconomic inequality in CHE in Iran.
-
Methods
- A total of 37 860 households were drawn from the Households Income and Expenditure Survey, conducted by the Statistical Center of Iran in 2017. The prevalence of CHE was measured using a cut-off of spending at least 40% of the capacity to pay on healthcare services. The concentration curve and concentration index (C) were used to illustrate and measure the extent of socioeconomic inequality in CHE among Iranian households. The C was decomposed to identify the main factors explaining the observed socioeconomic inequality in CHE in Iran.
-
Results
- The prevalence of CHE among Iranian households in 2017 was 5.26% (95% confidence interval [CI], 5.04 to 5.49). The value of C was -0.17 (95% CI, -0.19 to -0.13), suggesting that CHE was mainly concentrated among socioeconomically disadvantaged households in Iran. The decomposition analysis highlighted the household wealth index as explaining 71.7% of the concentration of CHE among the poor in Iran.
-
Conclusions
- This study revealed that CHE is disproportionately concentrated among poor households in Iran. Health policies to reduce socioeconomic inequality in facing CHE in Iran should focus on socioeconomically disadvantaged households.
- Ensuring access to necessary healthcare for all individuals without financial barriers remains a major public health concern in all countries, regardless of their level of development [1-4]. Protection against the financial burden of ill health is considered to be one of the primary objectives of all health systems throughout the world [5]. Lack of financial protection against unpredicted and expensive healthcare services can potentially lead to catastrophic healthcare expenditures (CHE) and household impoverishment. CHE has widely been defined as out-of-pocket (OOP) payments for healthcare exceeding “40% of (a household’s) capacity to pay” [6]. Reducing the prevalence of CHE is an important health policy challenge in all countries, including Iran [1,7].
- More than 44 million households experience CHE throughout the world annually [8]. Most of these households are in developing countries, where OOP payments comprise the main resource of healthcare financing [9,10]. A comprehensive analysis of 183 countries reported that the proportion of OOP payments in total health spending throughout the world and in high-income countries, upper-middle income countries, lower-middle income, and low-income countries was 22.8%, 13.9%, 33.8%, 58.0%, and 29.1%, respectively [11].
- The healthcare system in Iran is financed by multiple resources, including government health spending, prepaid private spending, and OOP payments. Approximately 48% of total healthcare expenditures in Iran are financed by OOP payments [9]. The substantial share of OOP payments of total healthcare spending in Iran results in a higher probability of exposure to CHE for households. A meta-analysis study by Rezaei et al. [12] found that approximately 7% of households face CHE in Iran, even though Iran’s Fourth and Fifth Five-Year Developmental Plan act, in its 90th article, indicates that reducing the percentage of households exposed to CHE to 1% is one of the main objectives of the health care system.
- Exposure to CHE varies across socioeconomic segments of a population, and its prevalence varies among and within countries [2,13]. Previous studies [1,14-19] indicated that factors such as socio-demographic variables, health utilization, and economic status were the main determinants of exposure to CHE among households. For example, a study by Hajizadeh and Nghiem [13] in Iran indicated that low socioeconomic status (SES) of households was one of the main factors increasing the probability of facing CHE for hospital services.
- Although to date, some research [15] has investigated socioeconomic-related inequality in facing CHE among households in different regions of Iran, socioeconomic inequalities in CHE in Iran and across its provinces are poorly understood. To fill this gap in the literature, this study aimed to measure the extent of socioeconomic inequality in CHE and identify the main factors that explain this inequality in Iran.
INTRODUCTION
- Study Setting
- Iran is a low-middle-income country located in the eastern Mediterranean region, with an area of 1 648 000 km2. Based on 2016 census data, the population of Iran was approximately 80 million people, living in 31 provinces.
- Data, Sampling Method, and Variables
- Data were drawn from the 2017 Iranian Household Income and Expenditure Survey (IHIES). The IHIES is an annual income and expenditure survey conducted by the Statistical Center of Iran (SCI) in all 31 provinces of Iran. The unit of analysis in the survey is the household, and face-to-face interviews with heads of households are used to complete a detailed questionnaire about the income and expenditures of households throughout the year. The survey collects information on the socio-demographic characteristics of household members, the household’s assets and living facilities, food and non-food spending, and household income. Non-food expenditures of households also include all spending for outpatient and inpatient care, dental care, paramedical care, informal payments, drugs, and health insurance premiums. A multistage sampling with geographical stratification was used to select households by the SCI. A total of 37 860 households were included in the IHIES.
- The outcome variable of interest in the study was a binary variable indicating whether or not a household faced CHE. As suggested by Xu et al. [17], the capacity to pay (CTP) of the household was used to determine the CHE. If the total health spending of a household equalled or exceeded 40% of its monthly CTP, the household was categorized as having faced CHE. Based on the literature [15,17,20], the effective income (in our study we used total expenditures as a proxy for total income) minus basic subsistence needs adjusted for household size was defined as household’s CTP. More details about the calculation of CHE can be found elsewhere [21,22].
- Household size; age, sex, and educational status of the head of household; having a senior member (over 65 years) or a child member (5 years or younger) of the household; residential place of the household (rural vs. urban); province; health insurance coverage; use of inpatient care, dental care, and outpatient care; and the wealth index of the household were analyzed as determinants of CHE in Iran. Principal component analysis (PCA) was used to construct the wealth index of each household [23,24]. To calculate the wealth index, the number of rooms per capita, type of house ownership, house size (in square meters), car ownership, and ownership of other goods (such as color TV, Internet, computers/laptops, cell phones, freezers, dishwashers, microwaves, vacuum cleaners, motorcycles, bicycles, etc.) were entered in the PCA. Based on the wealth scores obtained from the PCA, all households were grouped into 5 SES groups, from the poorest (first SES quintile) to wealthiest (fifth SES quintile). Table 1 presents descriptions of the variables used in the study.
- Statistical Analysis
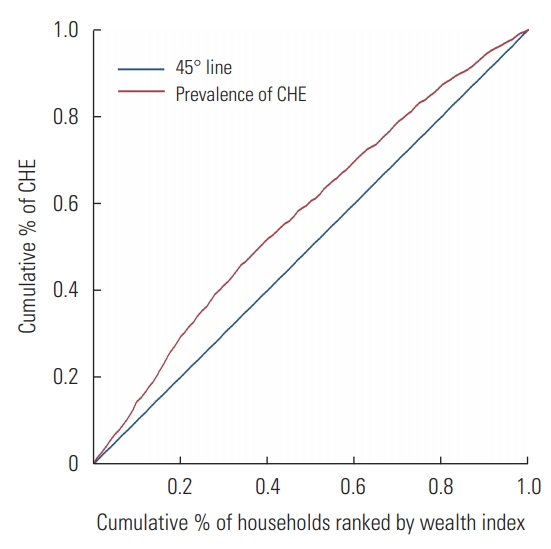
- The concentration curve and the concentration index (C) [25-27] were used to examine socioeconomic inequality in facing CHE among households in Iran. We also used the decomposition method to identify the main explanatory variables of the observed socioeconomic-related inequality in CHE. The concentration curve is a graph that depicts the cumulative percentage of a health outcome (CHE) on the y-axis against the cumulative percentage of the population ranked by an SES-related variable on the x-axis. If the concentration curve lies above the line of perfect equality (the 45° line), the health outcome variable is more prevalent among the poor, and vice versa for the rich. The C is defined as twice the area between the concentration curve and the line of perfect equality. If the sign of C is negative, the health outcome is more concentrated among the poor, and vice versa for the rich. Since the outcome variable in the study, CHE, is binary, the minimum and maximum of the C were not -1 and +1, respectively. To overcome this issue, we normalized the C, as suggested by Wagstaff [26], by multiplying the estimated C by 1⁄(1-μ).
- The C was decomposed to compare the extent to which the observed determinants of CHE contributed to the socioeconomic inequality in CHE in Iran [28]. Suppose we have a regression model linking our CHE variable,у, to a set of ĸ explanatory factors,xk, as follows:
- The C for CHE can be decomposed as follows:
- where C is the value of C for CHE,
- As CHE is a binary variable, we used marginal effects obtained from a logit model as βk in the decomposition analysis. All analyses were performed in Stata version 14.2 (StataCorp., College Station, TX, USA).
- Ethics Statement
- The study protocol was reviewed and approved by the Ethics Committee of the Deputy of Research, Kermanshah University of Medical Sciences (KUMS.REC.1394.190).
METHODS
- Descriptive Results
- The descriptive characteristics of the respondents included in the study are presented in Table 1. A total of 37 860 respondents were included in the study. The majority of households (86.1%) were headed by males. The average age of the heads of households was 51.6 years (standard deviation [SD], 15.5). Households were equally distributed by geographic area (49.3% in urban vs. 50.7% in rural areas). The average total monthly household expenditures, healthcare expenditures, and food expenditures were 18.80 million (SD, 16.10), 1.97 million (SD, 3.64), and 5.51 million (SD, 5.51) Iranian rials, respectively.
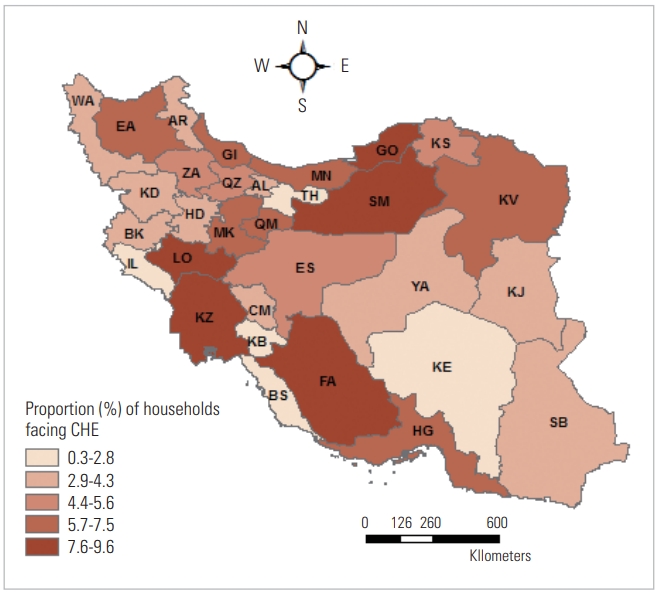
- On average, 5.26% (95% confidence interval [CI], 5.04 to 5.49) of households faced CHE in Iran in 2017. There was high variation across provinces in the prevalence of CHE in Iran. While fewer than 1% of the households of Kohgiluyeh and Buyer-Ahmad Province faced CHE in 2017, this figure was as high as 10% in Golestan Province. As demonstrated in Figure 1, the proportion of households facing CHE was greater in Semnan, Khuzestan, Lorestan, Fars, and Golestan Provinces than in other provinces.
- Our study indicated that the percentage of urban and rural households facing CHE was 4.02% (95% CI, 3.74 to 4.31) and 6.46% (95% CI, 6.12 to 6.82), respectively. The prevalence of CHE varied by individuals’ SES. While the proportion of CHE among the poorest households was 7.73% (95% CI, 7.14 to 8.35), the corresponding proportion for the wealthiest households was 3.37% (95% CI, 2.98 to 3.80).
- Socioeconomic Inequalities in Catastrophic Health Expenditures
- As illustrated in Figure 2, the concentration curve for CHE lay above the line of perfect equality, suggesting a higher concentration of CHE among socioeconomically disadvantaged households. The negative value of the estimated Cn for CHE (-0.17; 95% CI, -0.19 to -0.13) also indicated a higher prevalence of CHE among the poor. The estimated values of the Cn for urban (-0.16; 95% CI, -0.20 to -0.12) and rural (-0.16; 95% CI, -0.19 to -0.13) areas also highlighted higher concentrations of CHE among the poor.
- Decomposition of Socioeconomic Inequalities in Catastrophic Health Expenditures
- Table 2 presents the results of the decomposition analysis of socioeconomic inequality in CHE among Iranian households. Table 2 reports the marginal effects, elasticity, and the C of determinants and the contribution of determinants to the Cn. Based on the marginal effects of the explanatory variables, older age of the head of household was associated with a higher probability of facing CHE. Compared with male-headed households, female-headed households had a 0.3% higher probability of facing CHE. Household size was associated with a lower probability of facing CHE. A higher wealth index of the household was negatively associated with the probability of facing CHE (e.g., compared to the poorest SES quintile group, the wealth SES quintile had a 3.2% lower probability of facing CHE). The probability of facing CHE was higher for households living in rural areas and with health insurance coverage. Utilization of inpatient care, outpatient care, and dental care in the household was associated with 5.0%, 1.9%, and 5.1% higher probabilities of facing CHE, respectively.
- The C of the explanatory variables suggested that female-headed households, households headed by older adults, households with illiterate heads, and households with a senior member (65 years and older) were less wealthy in Iran. In contrary, households in rural areas, with health insurance coverage, with a recent history of utilizing healthcare services (e.g., inpatient, outpatient, and dental care), with a child aged 5 years and younger, and with a larger household size were relatively wealthy.
- The results of the contributions of the explanatory variables suggest that the wealth index of households, itself, made a significant negative contribution to the observed socioeconomic inequality in CHE in Iran. In other words, lower values of the wealth index were responsible for increasing the concentration of CHE among worse-off households in Iran. Although other socio-demographic factors, such as a female or senior head of household, a larger household size, and having senior members also made negative contributions to the Cn, the percentage contributions of these factors to the observed socioeconomic inequality in CHE was not significant. In contrast, the residential variable made a positive contribution to socioeconomic inequality in CHE.
RESULTS
- Protection against CHE is defined as one of the main objectives of health systems in all countries. In low-income and middle-income countries such as Iran, where OOP payments are the main source of healthcare funding, protection of households against CHE is a major public health and political concern. In this study, for the first time, we aimed to measure and decompose socioeconomic inequality in CHE among Iranian households using the concentration index approach.
- Descriptive statistics revealed that 5.3% of households in Iran faced CHE in 2017. The proportion of households with CHE in urban and rural areas was 4.0% and 6.5%, respectively. We observed variation in households facing CHE across Iranian provinces, from 0.4% in Kohgiluyeh and Buyer-Ahmad Province to 9.6% in Golestan Province. Other studies have also pointed out regional differences in the prevalence of CHE in Iran [29]. The results of our study indicated that CHE was concentrated among poor households in Iran. This finding is consistent with previous studies [30,31] conducted in Iran and other countries. A study conducted by Kavosi et al. [15] also found a higher concentration of CHE among the poor in Tehran in 2008.
- Our regression analysis showed that the wealth index of households in Iran was a factor that protected them from facing CHE. This result is similar to those of other studies conducted worldwide [32-34]. Since poor households have a lower capacity to pay, the burden of OOP payments has a significant impact on the poor. In addition to the effects of the wealth index of households, households headed by older adults or women, with health insurance coverage, with a senior member in the household, with a recent history of healthcare utilization (e.g., inpatient, outpatient, and dental care), and living in a rural area showed a positive association with CHE. A study conducted in Turkey also demonstrated that living in a rural area and having an elderly or disabled person in the household were highly related to CHE [21]. A study in Kerman Province (in southeastern Iran) revealed that living in a rural area and using health services increased the probability of facing CHE [16]. A positive association between having health insurance coverage and facing CHE has also been reported in previous studies. For example, a study in China by Wagstaff and Lindelow [35] indicated that, compared to uninsured people, individuals with health insurance coverage had a higher probability of facing CHE. The latter study concluded that having health insurance may encourage individuals to receive healthcare services when they become sick and to receive these services from expensive providers.
- Our decomposition analysis indicated that the wealth index of households, independently from other factors, made a negative contribution to the concentration of CHE among socioeconomically disadvantaged households. In other words, the wealth index of households increased the concentration of CHE among poorer households. This latter finding is similar to a study conducted by Kavosi et al. [15], which showed that the majority (83%) of the observed socioeconomic inequality in facing CHE in Tehran, Iran, was determined by households’ economic status.
- The present study is subject to some limitations that should be considered in the interpretation of the findings. First, as this was a cross-sectional study, we were unable to establish any causal relationship between facing CHE and its determinants. Self-reported household expenditures are prone to recall bias. Nonetheless, to summarize, this study revealed a higher concentration of CHE among socioeconomically disadvantaged households in Iran and its provinces. Thus, health policies such as reducing OOP payments for healthcare should focus on poor households in Iran to reduce socioeconomic inequality in facing CHE.
DISCUSSION
-
CONFLICT OF INTEREST
The authors have no conflicts of interest associated with the material presented in this paper.
Notes
ACKNOWLEDGEMENTS
-
AUTHOR CONTRIBUTIONS
Conceptualization: SR. Data curation: SR. Formal analysis: MH. Funding acquisition: SR. Methodology: SR, MH. Project administration: SR. Visualization: SR. Writing - original draft: SR. Writing - review & editing: MH.
Notes

| Variables | Marginal effect | Elasticity | Concentration index |
Contribution |
||
|---|---|---|---|---|---|---|
| Value | Summed | Summed, % | ||||
| Demographic variables | ||||||
| Sex of household head | ||||||
| Male (reference) | ||||||
| Female | 0.003* | 0.009 | -0.312 | -0.003 | -0.003 | 1.83 |
| Age of household head (y) | ||||||
| 15-45 (reference) | ||||||
| 46-65 | 0.005*** | 0.037 | 0.080 | 0.003 | ||
| 66 and above | 0.015*** | 0.058 | -0.194 | -0.012 | -0.009 | 5.48 |
| Household size | ||||||
| ≤4 (reference) | ||||||
| > 4 | -0.006*** | -0.028 | 0.051 | -0.001 | -0.001 | 0.92 |
| Socioeconomic variables | ||||||
| Education status of the household head | ||||||
| Literate (reference) | ||||||
| Illiterate | 0.002 | 0.008 | -0.2806 | -0.002 | -0.002 | 1.47 |
| Wealth index of households | ||||||
| Poorest (reference) | ||||||
| Poor | -0.011 | -0.041 | -0.402 | 0.017 | ||
| Middle | -0.019 | -0.072 | -0.002 | 0.000 | ||
| Rich | -0.019 | -0.073 | 0.399 | -0.031 | ||
| Richest | -0.032 | -0.121 | 0.800 | -0.102 | -0.115 | 71.7 |
| Members ≤5 y | ||||||
| Yes | -0.001 | -0.003 | 0.020 | -0.000 | -0.000 | 0.35 |
| No (reference) | ||||||
| Members ≥65 y | ||||||
| Yes | 0.004*** | 0.017 | -0.097 | -0.002 | -0.002 | 1.07 |
| No (reference) | ||||||
| Insurance coverage | ||||||
| Yes | 0.006*** | 0.109 | 0.014 | 0.002 | 0.002 | -0.97 |
| No (reference) | ||||||
| Utilization of healthcare | ||||||
| Inpatient care | ||||||
| Used | 0.050*** | 0.154 | 0.054 | 0.009 | 0.009 | -5.44 |
| Not used (reference) | ||||||
| Outpatient care | ||||||
| Used | 0.019*** | 0.083 | 0.067 | 0.006 | 0.006 | -3.68 |
| Not used (reference) | ||||||
| Dental care | ||||||
| Used | 0.051*** | 0.045 | 0.237 | 0.011 | 0.011 | -7.10 |
| Not used (reference) | ||||||
| Ecological variables | ||||||
| Geographical area | ||||||
| Urban (reference) | ||||||
| Rural | 0.026*** | 0.250 | 0.094 | 0.025 | 0.025 | -15.41 |
| Province | ||||||
| Tehran (reference) | ||||||
| Markazi | 0.012 | 0.009 | 0.019 | 0.000 | ||
| Gilan | 0.018*** | 0.011 | -0.098 | -0.001 | ||
| Mazandaran | 0.027 | 0.015 | 0.186 | 0.003 | ||
| East Azerbaijan | 0.009 | 0.006 | 0.044 | 0.000 | ||
| West Azerbaijan | 0.005*** | 0.003 | 0.062 | 0.000 | ||
| Kermanshah | -0.009*** | -0.005 | -0.240 | 0.001 | ||
| Khuzestan | 0.021*** | 0.014 | -0.179 | -0.003 | ||
| Fars | 0.027*** | 0.020 | 0.087 | 0.002 | ||
| Kerman | -0.010*** | -0.006 | -0.389 | 0.002 | ||
| Razavi Khorasan | 0.010* | 0.008 | -0.031 | 0.000 | ||
| Esfahan | 0.002 | 0.001 | 0.282 | 0.000 | ||
| Sistan and Baluchestan | 0.007 | 0.005 | -0.608 | -0.003 | ||
| Kurdistan | -0.007 | -0.003 | -0.067 | 0.000 | ||
| Hamadan | -0.004 | -0.002 | 0.092 | 0.000 | ||
| Chahar Mahall and Bakhtiari | -0.002*** | -0.001 | 0.185 | 0.000 | ||
| Lorestan | 0.023*** | 0.012 | -0.133 | -0.002 | ||
| Ilam | -0.011*** | -0.005 | -0.215 | 0.001 | ||
| Kohgiluyeh and Buyer-Ahmad | -0.023*** | -0.013 | 0.065 | -0.001 | ||
| Bushehr | -0.005 | -0.003 | 0.020 | 0.000 | ||
| Zanjan | 0.001 | 0.001 | -0.039 | 0.000 | ||
| Semnan | 0.025*** | 0.012 | 0.107 | 0.001 | ||
| Yazd | 0.001 | 0.001 | 0.355 | 0.000 | ||
| Hormozgan | 0.003 | 0.002 | 0.202 | 0.000 | ||
| Ardebil | -0.007 | -0.004 | -0.018 | 0.000 | ||
| Qom | 0.016*** | 0.008 | 0.196 | 0.002 | ||
| Qazvin | 0.001 | 0.001 | 0.126 | 0.000 | ||
| Golestan | 0.031*** | 0.021 | 0.012 | 0.000 | ||
| North Khorasan | 0.000 | 0.000 | -0.088 | 0.000 | ||
| South Khorasan | -0.002 | -0.002 | -0.019 | 0.000 | ||
| Alborz | 0.005 | 0.003 | 0.267 | 0.001 | 0.006 | -3.60 |
| Sum | -0.074 | 46.4 | ||||
| Residual | -0.086 | 53.6 | ||||
| Total Cn | -0.161 | 100.0 | ||||
- 1. Buigut S, Ettarh R, Amendah DD. Catastrophic health expenditure and its determinants in Kenya slum communities. Int J Equity Health 2015;14: 46ArticlePubMedPMCPDF
- 2. Li Y, Wu Q, Xu L, Legge D, Hao Y, Gao L, et al. Factors affecting catastrophic health expenditure and impoverishment from medical expenses in China: policy implications of universal health insurance. Bull World Health Organ 2012;90(9):664-671ArticlePubMedPMC
- 3. Limwattananon S, Tangcharoensathien V, Prakongsai P. Catastrophic and poverty impacts of health payments: results from national household surveys in Thailand. Bull World Health Organ 2007;85(8):600-606ArticlePubMedPMC
- 4. Islam MR, Rahman MS, Islam Z, Nurs CZ, Sultana P, Rahman MM. Inequalities in financial risk protection in Bangladesh: an assessment of universal health coverage. Int J Equity Health 2017;16(1):59ArticlePubMedPMCPDF
- 5. World Health Organization. The world health report 2000: health systems-improving performance. [cited 2019 Jul 10]. Available from: https://www.who.int/whr/2000/en/
- 6. Elani HW, Harper S, Allison PJ, Bedos C, Kaufman JS. Socio-economic inequalities and oral health in Canada and the United States. J Dent Res 2012;91(9):865-870ArticlePubMed
- 7. Wagstaff A, van Doorslaer E. Catastrophe and impoverishment in paying for health care: with applications to Vietnam 1993-1998. Health Econ 2003;12(11):921-934ArticlePubMed
- 8. Xu K, Evans DB, Carrin G, Aguilar-Rivera AM. Designing health financing systems to reduce catastrophic health expenditure. 2005 [cited 2019 Jul 10]. Available from: https://www.who.int/health_financing/documents/cov-pb_e_05_2-cata_sys/en/
- 9. Global Burden of Disease Health Financing Collaborator Network. Spending on health and HIV/AIDS: domestic health spending and development assistance in 188 countries, 1995-2015. Lancet 2018;391(10132):1799-1829PubMedPMC
- 10. Global Burden of Disease Health Financing Collaborator Network. Trends in future health financing and coverage: future health spending and universal health coverage in 188 countries, 2016-40. Lancet 2018;391(10132):1783-1798PubMedPMC
- 11. Global Burden of Disease Health Financing Collaborator Network. Evolution and patterns of global health financing 1995-2014: development assistance for health, and government, prepaid private, and out-of-pocket health spending in 184 countries. Lancet 2017;389(10083):1981-2004PubMedPMC
- 12. Rezaei S, Woldemichael A, Hajizadeh M, Kazemi Karyani A. Catastrophic healthcare expenditures among Iranian households: a systematic review and meta-analysis. Int J Hum Rights Healthc 2019;12(2):105-115Article
- 13. Hajizadeh M, Nghiem HS. Out-of-pocket expenditures for hospital care in Iran: who is at risk of incurring catastrophic payments? Int J Health Care Finance Econ 2011;11(4):267-285ArticlePubMedPDF
- 14. Ghiasvand H, Sha’baninejad H, Arab M, Rashidian A. Hospitalization and catastrophic medical payment: evidence from hospitals located in Tehran. Arch Iran Med 2014;17(7):507-513PubMed
- 15. Kavosi Z, Rashidian A, Pourreza A, Majdzadeh R, Pourmalek F, Hosseinpour AR, et al. Inequality in household catastrophic health care expenditure in a low-income society of Iran. Health Policy Plan 2012;27(7):613-623ArticlePubMedPDF
- 16. Moghadam MN, Banshi M, Javar MA, Amiresmaili M, Ganjavi S. Iranian household financial protection against catastrophic health care expenditures. Iran J Public Health 2012;41(9):62-70PubMedPMC
- 17. Xu K, Evans DB, Kawabata K, Zeramdini R, Klavus J, Murray CJ. Household catastrophic health expenditure: a multicountry analysis. Lancet 2003;362(9378):111-117ArticlePubMed
- 18. Gotsadze G, Zoidze A, Rukhadze N. Household catastrophic health expenditure: evidence from Georgia and its policy implications. BMC Health Serv Res 2009;9: 69ArticlePubMedPMCPDF
- 19. Xu K, Evans DB, Carrin G, Aguilar-Rivera AM, Musgrove P, Evans T. Protecting households from catastrophic health spending. Health Aff (Millwood) 2007;26(4):972-983ArticlePubMed
- 20. World Health Organization. Health systems performance assessment: debates, methods and empiricism. 2003 [cited 2019 Jul 10]. Available from: https://www.who.int/health_financing/documents/cov-hspa/en/
- 21. Yardim MS, Cilingiroglu N, Yardim N. Catastrophic health expenditure and impoverishment in Turkey. Health Policy 2010;94(1):26-33ArticlePubMed
- 22. World Health Organization. Distribution of health payments and catastrophic expenditures: methodology. 2005 [cited 2019 Jul 10]. Available from: https://www.who.int/health_financing/documents/cov-dp_05_2_health_payments/en/
- 23. Vyas S, Kumaranayake L. Constructing socio-economic status indices: how to use principal components analysis. Health Policy Plan 2006;21(6):459-468ArticlePubMedPDF
- 24. Kolenikov S, Angeles G. Socioeconomic status measurement with discrete proxy variables: is principal component analysis a reliable answer? Rev Income Wealth 2009;55(1):128-165Article
- 25. Koolman X, van Doorslaer E. On the interpretation of a concentration index of inequality. Health Econ 2004;13(7):649-656ArticlePubMed
- 26. Wagstaff A. The concentration index of a binary outcome revisited. Health Econ 2011;20(10):1155-1160ArticlePubMed
- 27. O’Donnell O, O’Neill S, Van Ourti T, Walsh B. Conindex: estimation of concentration indices. Stata J 2016;16(1):112-138ArticlePubMedPMC
- 28. Wagstaff A, van Doorslaer E, Watanabe N. On decomposing the causes of health sector inequalities with an application to malnutrition inequalities in Vietnam. J Econom 2003;112(1):207-223Article
- 29. Yazdi-Feyzabadi V, Bahrampour M, Rashidian A, Haghdoost AA, Akbari Javar M, Mehrolhassani MH. Prevalence and intensity of catastrophic health care expenditures in Iran from 2008 to 2015: a study on Iranian household income and expenditure survey. Int J Equity Health 2018;17(1):44ArticlePubMedPMCPDF
- 30. Si Y, Zhou Z, Su M, Ma M, Xu Y, Heitner J. Catastrophic healthcare expenditure and its inequality for households with hypertension: evidence from the rural areas of Shaanxi Province in China. Int J Equity Health 2017;16(1):27ArticlePubMedPMCPDF
- 31. Boing AC, Bertoldi AD, Barros AJ, Posenato LG, Peres KG. Socioeconomic inequality in catastrophic health expenditure in Brazil. Rev Saude Publica 2014;48(4):632-641ArticlePubMedPMCPDF
- 32. Asefzadeh S, Alijanzadeh M, Gholamalipoor S, Farzaneh A. Households encountering with catastrophic health expenditures in Qazvin, Iran. Health Inf Manag 2013;10(1):1-8. (Persian)
- 33. Soofi M, Rashidian A, Aabolhasani F, Sari AA, Bazyar M. Measuring the exposure of households to catastrophic healthcare expenditures in Iran in 2001: the World Health Organization and the World Bank’s approach. Hosp J 2013;12(2):39-50. (Persian)
- 34. Su TT, Kouyaté B, Flessa S. Catastrophic household expenditure for health care in a low-income society: a study from Nouna District, Burkina Faso. Bull World Health Organ 2006;84(1):21-27ArticlePubMedPMC
- 35. Wagstaff A, Lindelow M. Can insurance increase financial risk? The curious case of health insurance in China. J Health Econ 2008;27(4):990-1005ArticlePubMed
REFERENCES
Figure & Data
References
Citations
- Prevalence and Determinants of Catastrophic Healthcare Expenditures in Iran From 2013 to 2019
Abdoreza mousavi, Farhad lotfi, Samira Alipour, Aliakbar Fazaeli, Mohsen Bayati
Journal of Preventive Medicine and Public Health.2024; 57(1): 65. CrossRef - Examining the level and distribution of catastrophic health expenditure from 2013 to 2018: A province-level study in China
Mingsheng Chen, Lizheng Xu, Lei Si, Zhonghua Wang, Stephen Jan
Economic Modelling.2023; 121: 106233. CrossRef - Equity and extent of financial risk protection indicators during COVID-19 pandemic in rural part of Tamil Nadu, India
Yuvaraj Krishnamoorthy, Sathish Rajaa, Isha Sinha, Murali Krishnan, Gerald Samuel, Krishna Kanth
Heliyon.2023; 9(8): e18902. CrossRef - Catastrophic household expenditure associated with out-of-pocket payments for dental healthcare in Spain
Samuel López-López, Raúl del Pozo-Rubio, Marta Ortega-Ortega, Francisco Escribano-Sotos
The European Journal of Health Economics.2022; 23(7): 1187. CrossRef - User fee removal for the poor: a qualitative study to explore policies for social health assistance in Iran
Manal Etemadi, Mohammad Hajizadeh
BMC Health Services Research.2022;[Epub] CrossRef - A 25-Year Trend of Catastrophic Health Expenditure and Its Inequality in China: Evidence from Longitudinal Data
Yongjian Xu, Yiting Zhou, Andi Pramono, Yazhuo Liu, Cong Jia
Risk Management and Healthcare Policy.2022; Volume 15: 969. CrossRef - Decomposition of Socioeconomic Inequality in Cardiovascular Disease Prevalence in the Adult Population: A Cohort-based Cross-sectional Study in Northwest Iran
Farhad Pourfarzi, Telma Zahirian Moghadam, Hamed Zandian
Journal of Preventive Medicine and Public Health.2022; 55(3): 297. CrossRef - Financial risk protection from out-of-pocket health spending in low- and middle-income countries: a scoping review of the literature
Taslima Rahman, Dominic Gasbarro, Khurshid Alam
Health Research Policy and Systems.2022;[Epub] CrossRef - Incidence of catastrophic healthcare expenditure and its main determinants in Mexican households caring for a person with a mental disorder
Lina Diaz-Castro, Héctor Cabello-Rangel, Carlos Pineda-Antúnez, Alejandra Pérez de León
Global Mental Health.2021;[Epub] CrossRef - Unmet dental care need in West of Iran: determinants and inequality
Amjad Mohamadi-Bolbanabad, Farman Zahir Abdullah, Hossein Safari, Satar Rezaei, Abdorrahim Afkhamzadeh, Shina Amirhosseini, Afshin Shadi, Jamal Mahmoudpour, Bakhtiar Piroozi
International Journal of Human Rights in Healthcare.2021; 14(5): 426. CrossRef - The impact of out-of pocket payments of households for dental healthcare services on catastrophic healthcare expenditure in Iran
Abraha Woldemichael, Satar Rezaei, Ali Kazemi Karyani, Mohammad Ebrahimi, Shahin Soltani, Abbas Aghaei
BMC Public Health.2021;[Epub] CrossRef - Measuring Out-of-pocket Payment, Catastrophic Health Expenditure and the Related Socioeconomic Inequality in Peru: A Comparison Between 2008 and 2017
Akram Hernández-Vásquez, Carlos Rojas-Roque, Rodrigo Vargas-Fernández, Diego Rosselli
Journal of Preventive Medicine and Public Health.2020; 53(4): 266. CrossRef Incidence and Intensity of Catastrophic Health-care Expenditure for Type 2 Diabetes Mellitus Care in Iran: Determinants and Inequality
Bakhtiar Piroozi, Amjad Mohamadi-Bolbanabad, Ghobad Moradi, Hossein Safari, Shahnaz Ghafoori, Yadolah Zarezade, Farzam Bidarpour, Satar Rezaei
Diabetes, Metabolic Syndrome and Obesity: Targets and Therapy.2020; Volume 13: 2865. CrossRef- Trend and status of out-of-pocket payments for healthcare in Iran: equity and catastrophic effect
Satar Rezaei, Abraha Woldemichael, Mohammad Ebrahimi, Sina Ahmadi
Journal of the Egyptian Public Health Association.2020;[Epub] CrossRef - Catastrophic Out-of-Pocket Health Expenditure Among Rural Households in the Semi-Pastoral Community, Western Ethiopia: A Community-Based Cross-Sectional Study
Debelo Shikuro, Mezgebu Yitayal, Adane Kebede, Ayal Debie
ClinicoEconomics and Outcomes Research.2020; Volume 12: 761. CrossRef
 PubReader
 ePub Link
 Cite
Cite