
Articles
- Page Path
- HOME > J Prev Med Public Health > Volume 56(6); 2023 > Article
-
Original Article
Association Between Parental BMI and Offspring’s Blood Pressure by Mediation Analysis: A Study Using Data From the Korean National Health and Nutrition Examination Survey -
Hyowon Choi1
 , Hunju Lee1, Yeon-Soon Ahn1,2
 -
Journal of Preventive Medicine and Public Health 2023;56(6):533-541.
DOI: https://doi.org/10.3961/jpmph.23.289
Published online: October 30, 2023
- 1,535 Views
- 80 Download
1Department of Prevention Medicine, Yonsei University Wonju College of Medicine, Wonju, Korea
2Genomic Cohort Institute, Yonsei University Wonju College of Medicine, Wonju, Korea
- Corresponding author: Yeon-Soon Ahn, Department of Prevention Medicine, Yonsei University Wonju College of Medicine, 20 Ilsan-ro, Wonju 24626, Korea E-mail: ysahn1203@yonsei.ac.kr
Copyright © 2023 The Korean Society for Preventive Medicine
This is an Open Access article distributed under the terms of the Creative Commons Attribution Non-Commercial License (http://creativecommons.org/licenses/by-nc/4.0/) which permits unrestricted non-commercial use, distribution, and reproduction in any medium, provided the original work is properly cited.
ABSTRACT
-
Objectives
- This study analyzed the relationship between parental body mass index (BMI; BMI_p) and hypertension in their adolescent offspring (HTN_a), focusing on the mediating effect of adolescents’ BMI (BMI_a).
-
Methods
- Utilizing data from the Korea National Health and Nutrition Examination Survey, including participants aged 12-18, we conducted a mediation analysis while controlling for confounding factors such as age, sex, physical activity, dietary habits, household income quartile, and parents’ alcohol and smoking habits.
-
Results
- The study included a total of 5731 participants, of whom 3381 and 5455 participants had data on fathers’ and mothers’ BMI, respectively. For adolescent systolic blood pressure (SBP_a), the father’s BMI (BMI_f) had a significant total effect (β, 0.23; 95% confidence interval [CI], 0.12 to 0.34) and average controlled mediated effect (ACME) (β, 0.27; 95% CI, 0.23 to 0.32), but the average direct effect (ADE) was not significant. The mother’s BMI (BMI_m) had a significant total effect (β, 0.17; 95% CI, 0.09 to 0.25), ACME (β, 0.25; 95% CI, 0.22 to 0.28) and ADE (β, -0.08; 95% CI, -0.16 to 0.00). For adolescent diastolic blood pressure, both BMI_f and BMI_m had significant ACMEs (β, 0.10; 95% CI, 0.08 to 0.12 and β, 0.09; 95% CI, 0.07 to 0.12, respectively), BMI_m had a significant ADE (β, -0.09; 95% CI, -0.16 to -0.02) but BMI_f had an insignificant ADE and total effect.
-
Conclusions
- The study found that parental BMI had a significant effect on SBP_a, mediated through BMI_a. Therefore, a high BMI in parents could be a risk factor, mediated through BMI_a, for systolic hypertension in adolescents, necessitating appropriate management.
- According to the guidelines of the Korean Society of Pediatrics, hypertension in children and adolescents is defined as a blood pressure that exceeds the 95th percentile of age-specific blood pressure levels [1]. For adolescents aged 12 years to 18 years, hypertension is characterized by a systolic blood pressure of 130 mmHg or higher, and a diastolic blood pressure of 80 mmHg or higher [1,2]. Although the prevalence of hypertension in adolescents (HTN_a) has traditionally been reported to be between 1% and 3%, recent studies indicate an increasing trend in this demographic [3-6]. Common causes of hypertension in children under 6 years old include secondary conditions such as coarctation of the aorta, Cushing’s syndrome, and hyperthyroidism. However, in children over the age of six, the presence of factors such as a family history of hypertension or obesity may suggest a high likelihood of primary hypertension [1]. HTN_a is recognized as a risk factor for cardiovascular disease in adulthood. It can also lead to target organ damage, with conditions such as left ventricular hypertrophy and pathological vascular damage occurring more frequently. As such, management of this condition is strongly recommended [7].
- The prevalence of obesity among adolescents has been increasing in recent years [8]. As a result, metabolic syndrome, typically seen in adults, is increasingly being observed in children and adolescents, leading to heightened social and economic burdens [9]. Pediatric obesity has multiple causes, but it is particularly linked to parental obesity [8,10]. In Korea, there has been a surge in the prevalence of HTN_a, coinciding with the growing population of obese adolescents [8,11]. Numerous efforts are being made to encourage physical activity and enhance dietary habits among adolescents. However, due to the reduction in outdoor activities brought on by the coronavirus disease 2019 pandemic, the decline in physical activity among adolescents has become even more pronounced [12,13].
- Several recent studies have explored the parental factors that influence HTN_a [14-18]. Notably, a few of these studies have reported an association between parental obesity and the blood pressure of their offspring [15,16,18]. However, while it is widely accepted that family history impacts body mass index (BMI), which is a significant risk factor for hypertension, the extent to which parental obesity influences obesity in children and adolescents remains unclear [10,19]. The mechanism of this association was not discussed in these studies [15,16,18].
- Therefore, in this study, we aimed to investigate the effect of parental BMI (BMI_p) on HTN_a. We analyzed the direct effect of BMI_p on HTN_a, as well as its indirect effect on HTN_a through BMI in adolescents (BMI_a) using causal diagram.
INTRODUCTION
- Study Populations
- This study utilized data from the Korea National Health and Nutrition Examination Survey (KNHANES), specifically focusing on adolescents aged 12 to 18 from both married and single-parent families, between the years 2007 and 2021 [2]. Subjects with incomplete data on height, weight, blood pressure, diet, household income, or parental information were excluded from the study. Furthermore, those with extreme calorie intake levels, either less than 500 kcal/day or more than 5000 kcal/day, were also excluded [20].
- The purpose of KNHANES is to assess the health status of the Korean population through the use of multi-level, clustering, stratification, and rolling sampling methods. KNHANES, an annual national cross-sectional survey, has been conducted since 1998 by the Korea Disease Control and Prevention Agency [21].
- Study Model
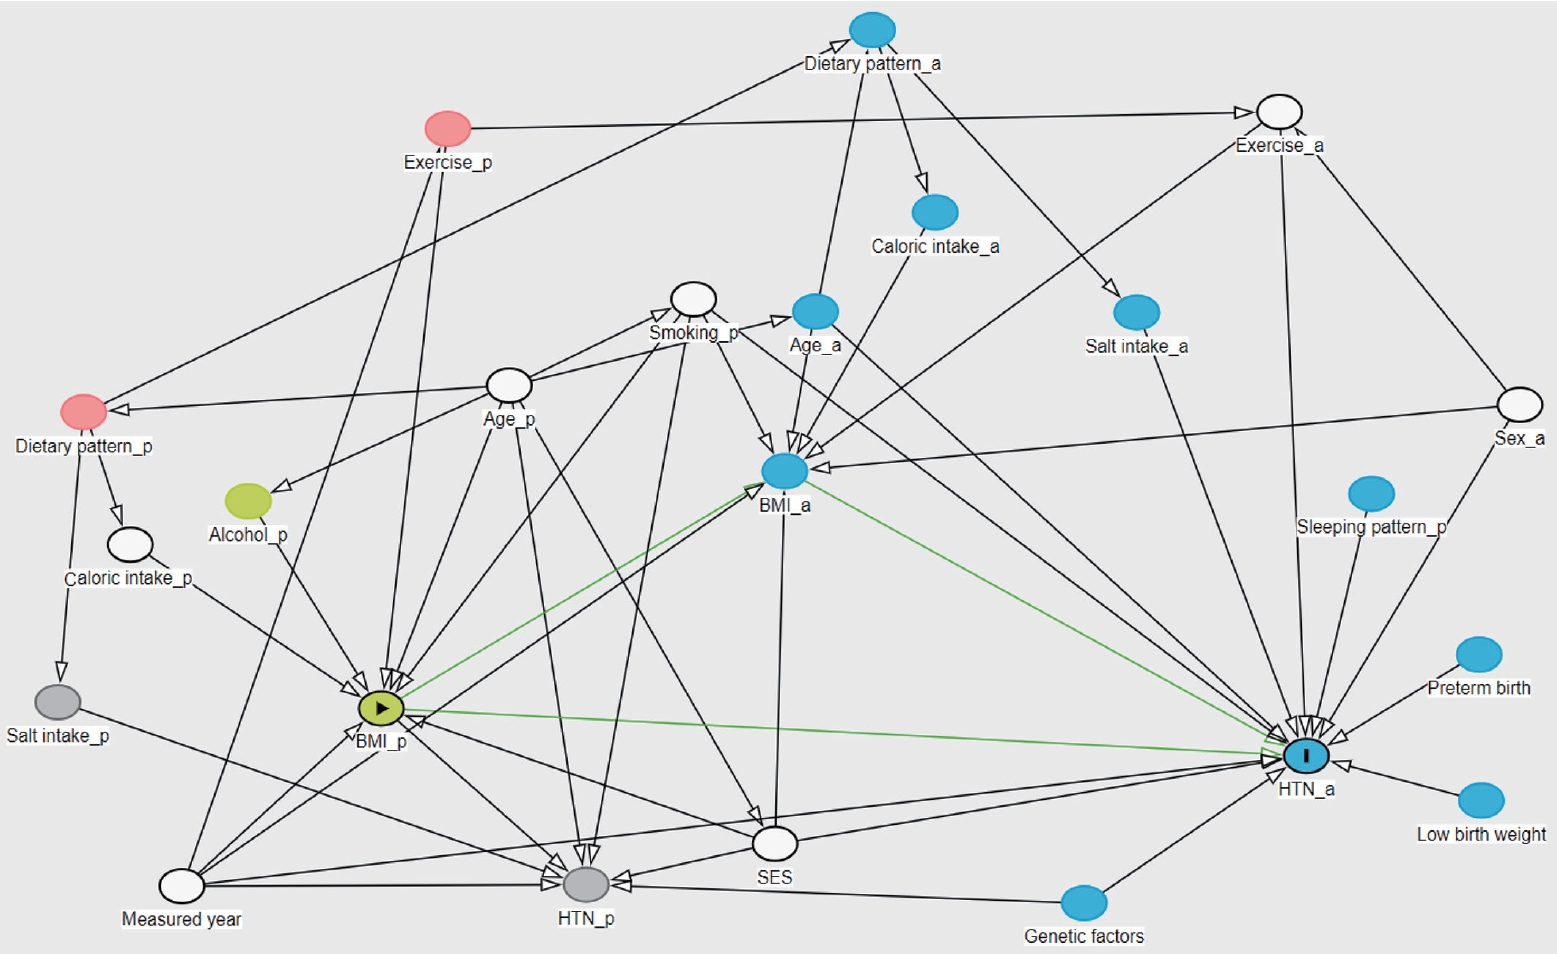
- We conducted our study using a directed acyclic graph (DAG) model [22]. Variables identified as risk factors for HTN_a—namely, adolescent’s sex, age, exercise habits, dietary intake (specifically sodium and caloric intake), socioeconomic status, genetic factors, and family history, as well as parental age, smoking and alcohol habits, and blood pressure—were considered as potential confounders [16,17].
- Exposure (BMI_p) and Mediator (BMI_a)
- During the survey, the height and weight of all adolescents and their parents were examined. The BMI is calculated using the formula: weight (kg) divided by height (m) squared. In the KNHANES, the participants’ weights were adjusted to account for the weight of typical clothing [21].
- Outcomes (Adolescent Blood Pressure)
- The blood pressure of the adolescents was assessed three times using a non-mercury auscultatory sphygmomanometer (Greenlight 300, Accoson, Irvine, UK) by a team of 4 medically trained staff members. The final blood pressure was determined by taking the average of the second and third measurements. HTN_a was characterized as a systolic blood pressure of 130 mmHg or above, and a diastolic blood pressure of 80 mmHg or above, for this particular age group [1].
- Confounding
- Physical activity levels in adolescents were evaluated based on whether they met the recommendation of engaging in at least 1 hour of moderate to vigorous physical activity daily. This level of activity would result in increased breathing and a slightly elevated heart rate [23]. A trained interviewer evaluated dietary intake 1 week after the health interview and examination, using the single 24-hour recall method. We calculated nutrient intakes using the Korean Foods and Nutrients Database of the Rural Development Administration [24], and we analyzed daily caloric intake (kcal/day) and sodium intake (mg/day).
- Parental smoking status was determined by assessing whether there was a history of smoking and whether the parent was currently a smoker or a non-smoker. Parental alcohol consumption was defined by the level of alcohol consumed monthly. Those who consumed less than 1 drink per month over a year were classified as non-drinkers, while those who consumed 1 or more drinks per month were classified as drinkers. Parental hypertension was determined based on a previous diagnosis or examination, as well as the average of the second and third blood pressure measurements (systolic blood pressure of 140 mmHg or higher and diastolic blood pressure of 90 mmHg or higher) [25]. Parental dyslipidemia was determined based on a previous diagnosis or a serum analysis during an examination (a fasting total cholesterol level of 240 mg/dL or higher, or fasting triglyceride level of 200 mg/dL or higher) [26]. Household income quartiles were calculated based on the average monthly household income divided by the square root of the number of household members, and then categorized into 4 groups. The year of measurement was also taken into account as a confounding factor.
- Using a DAG based on the available variables, the year of measurement, the adolescent’s sex, exercise level, parental smoking, parental age, household income, the adolescent’s sodium intake, and caloric intake were analyzed as confounders that could causally impact the relationship. The direct effect of BMI_p on HTN_a was investigated, as well as the mediating effect through BMI_a (Figure 1) (Supplemental Material 1).
- Statistical Analysis
- Descriptive statistics were calculated for all subject characteristics (mean±standard deviation, proportion). Following this, a linear regression analysis was conducted to examine the relationship between BMI_p and adolescents’ blood pressure. For the mediation analysis, BMI_p was selected as the exposure, BMI_a as the mediator, and the adolescent systolic blood pressure (SBP_a) and adolescent diastolic blood pressure (DBP_a) blood pressure of pediatric and adolescent subjects as the outcome.
- All analyses were conducted using both a crude and an adjusted model. The crude model was applied to the exposure and outcome, while the adjusted model incorporated the crude model along with confounders such as the measured year, adolescents’ sex, recommended exercise level, parents’ smoking habits, parents’ age, household income, and child caloric intake. We utilized R version 4.4.7 for the statistical analysis. In the linear regression analysis, we adjusted for the mediator and selected confounders. For the mediation analysis, we employed the R package “mediation” (version 4.4.7) [27], using bootstrapping, a method involving random sampling with 1000 simulations, to perform the statistical analysis. This approach is favored over the Baron and Kenny method due to its sensitivity to sample size, effect size, and type, as well as its low reliability [28].
- This study utilized observational data, which may contain unmeasurable variables that could potentially affect causal assumptions. To account for this, we performed a sensitivity analysis. The same R package was employed for this analysis. We conducted the sensitivity analysis on the changes in the correlation between the mediator and outcome variables (rho), as well as the product of R-squared values between the mediator and outcome variables (R2 MR2Y). To determine the sensitivity region, we specified the range of rho and R2 MR2Y values and estimated the average controlled mediated effect (ACME) for each combination of values through 1000 simulations. All statistical analyses were conducted using R version 4.2.3 (R Foundation for Statistical Computing, Vienna, Austria), with all statistical evaluations based on a p-value of 0.05.
- Ethics Statement
- KNHANES was conducted with the approval of the Institutional Review Board of the Korea Disease Control and Prevention Agency (No. 2007-02CON-04-P, 2008-04EXP-01-C, 2009- 01CON-03-2C, 2010-02CON-21-C, 2011-02CON-06-C, 2012-01EXP-01-2C, 2013-07CON-03-4C, 2013-12EXP-03-5C, 2018-01-03-P-A, 2018-01-03-C-A, 2018-01-03-2C-A, 2018-01-03-3CA). This study was conducted in accordance with the Declaration of Helsinki.
METHODS
- Population Characteristics
- A total of 7718 subjects were initially enrolled in the study. However, after excluding 811 subjects due to missing data and 1176 subjects due to excessive caloric intake, the final sample size for analysis was 5731. Of these subjects, data was available for 3381 fathers and 5455 mothers (Supplemental Material 2).
- The characteristics of the subjects were as follows: the mean age was 14.7±2.0 years, the mean BMI was 21.1±3.7 kg/m2, the mean SBP_a was 107.8±10.1 mmHg, the mean DBP_a was 67.2±8.7 mmHg, the mean caloric intake was 2111.7±802.2 kcal/day, and the mean sodium intake was 3707.2±2110.1 mg/day. The male-to-female ratio was 1.1%, and 21.2% of the subjects engaged in recommended levels of physical activity. Furthermore, 85.3% of the households consisted of married parents, while 14.7% were single parents, and the prevalence of HTN_a was 1.1% (Table 1).
- For fathers, the mean age was 46.7±4.6 years, the mean BMI was 24.8±3.1 kg/m2, and the mean caloric intake and sodium intake were 2415.4±795.7 kcal/day and 5395.1±2914.3 mg/day, respectively. The prevalence of hypertension was 15.6%. and 50.5% were never-smokers (Table 2).
- For mothers, the mean age was 43.6±4.2 years, the mean BMI was 23.3±3.4 kg/m2, and the mean caloric intake and sodium intake were 1727.7±618.0 kcal/day and 3863.7±2757.1 mg/day, respectively. The prevalence of hypertension was 6.2%, and 95.2% were never-smokers (Table 2).
- Linear Regression Model
- In the crude linear regression model, there was a positive correlation between paternal BMI (BMI_f) and SBP_a (β=0.23, p<0.001). However, in the adjusted model, the correlation between BMI_f and SBP_a was not statistically significant (β=-0.05, p=0.37). BMI_a had a positive correlation with SBP_a (β=0.79, p<0.001). The crude and adjusted models showed that BMI_f and DBP_a had no statistically significant relationship. However, BMI_a had a positive correlation with DBP_a (β=0.30, p<0.001) (Table 3).
- In mothers, the crude model showed a statistically significant association between maternal BMI (BMI_m) and SBP_a (β=0.17, p<0.001). However, in the adjusted model, BMI_m and SBP_a had a negative correlation (β=-0.08, p<0.05), and the correlation between BMI_a and SBP_a was positive (β=0.80, p<0.001). The correlation between BMI_m and DBP_a was not statistically significant in either the crude or adjusted model, whereas there was a positive correlation between BMI_a and DBP_a (β=0.30, p<0.001) (Table 3).
- Mediation Analysis
- The mediation analysis showed that in the crude model, the ACME of BMI_f on SBP_a was statistically significant (β, 0.27; 95% confidence interval [CI], 0.23 to 0.32), as was the total effect (β, 0.23; 95% CI, 0.12 to 0.34), but the average direct effect (ADE) was not significant. In the adjusted model, the ACME and total effect were statistically significant (β, 0.24; 95% CI, 0.20 to 0.28 and β, 0.19; 95% CI, 0.09 to 0.30), but the ADE was not significant. The crude model showed that BMI_f had a statistically significant ACME on DBP_a (β, 0.10; 95% CI, 0.07 to 0.13), but the ADE and total effect were not significant. In the adjusted model, the ACME was statistically significant (β, 0.10; 95% CI, 0.06 to 0.12), but the ADE and total effect were not significant (Table 4). The β value for ACME indicates the change in the outcome variable (SBP_a) corresponding to each unit change in the predictor (BMI_f) that is mediated through the mediator (BMI_a). Specifically, a β value of 0.27 for ACME in the crude model implies that for every 1 kg/m2 increase in BMI_f, there is a corresponding increase of 0.27 mmHg in SBP_a, mediated through the BMI_a.
- The crude model showed statistically significant ACME, ADE, and total effects of BMI_m on SBP_a (β, 0.28; 95% CI, 0.25 to 0.32; β, -0.11; 95% CI, -0.19 to -0.04; and β, 0.17; 95% CI, 0.09 to 0.25, respectively). Furthermore, in the adjusted model, ACME and the total effect were statistically significant (β, 0.25; 95% CI, 0.22 to 0.28 and β, 0.17; 95% CI, 0.10 to 0.25). However, ADE was not significant. For DBP_a in the crude model, ACME and ADE were statistically significant (β, 0.10; 95% CI, 0.08 to 0.12 and β, -0.09; 95% CI, -0.15 to -0.01, respectively), but the total effect was not statistically significant. In the adjusted model, the β value of ACME was 0.09 (95% CI, 0.07 to 0.12), and the β value of ADE was -0.09 (95% CI, -0.16 to -0.02), but the total effect and proportion mediated were not statistically significant (Table 4). A sensitivity analysis confirmed that the mediation effect of BMI_p on SBP_a and DBP_a was sufficient (Supplemental Materials 3, 4).
RESULTS
- In this study, an analysis of KNHANES data from 2007 to 2021 showed that BMI_p had a positive total effect and a β value for the mediating effect on SBP_a. However, the ADE for BMI_f was not significant. Conversely, for BMI_m, the β value of the ADE was negative and statistically significant. In the absence of considering the mediation effect of BMI_a, BMI_p emerged as a significant risk factor for HTN_a. However, when the mediation of BMI_a was factored in, BMI_p was no longer statistically significant. Instead, BMI_a demonstrated a statistically significant mediation effect [29].
- The mechanisms regulating adolescent blood pressure are not well understood, but they may be influenced by both genetic and environmental factors. According to the results of our study, adolescent blood pressure is largely influenced by environmental factors. Certain genes, such as ADD1, LSS, and KL, are associated with adolescent blood pressure, and some of these are related to familial BMI [30,31]. Maternal lifestyle during pregnancy may be associated with epigenetic changes in offspring [32]. Furthermore, epigenetic information could be imprinted on parental chromosomes, potentially affecting their offspring [33]. Obesity also has a familial history, which can be attributed to either environmental or genetic factors [34]. Among environmental factors, the dietary patterns and physical activities of offspring are often modeled after those of their parents [35,36]. A previous study by Xu et al. [37], which focused on children, reported that parental overweight status affects systolic blood pressure and diastolic blood pressure in children through adiposity, with the children’s BMI z-score being the most significant mediator. In our study, we also found that in adolescence, BMI_p has a mediating effect on HTN_a, through the mediation of BMI_a.
- In our study, the β values for ACME were larger than the total effects. This indicates a negative direct effect of BMI_m on SBP_a. While there are several studies on genetic and epigenetic factors in childhood, only a few have focused on the regulation of genes and environmental factors during adolescence [30-32]. Therefore, further research is needed to bridge the gap from childhood to adolescence, with a focus on investigating genetic and epigenetic factors.
- Only systolic blood pressure demonstrated a significant mediating effect on BMI_a. Given that systolic blood pressure is impacted before diastolic blood pressure [38], it appears that only SBP_a was affected in our study, likely due to the adolescent age of our population. SBP_a is known to have a relationship with left ventricular morphology in children and adolescents, even more so than diastolic blood pressure [39]. Elevated SBP_a can result in target organ damage, including hypertensive nephropathy, retinopathy, and cognitive dysfunction, potentially leading to serious health issues in adulthood [39,40].
- This study found that BMI_p had a limited direct effect on SBP_a, but it affected SBP_a through mediation by BMI_a. Therefore, even if BMI_p is high, managing BMI_a through various health promotion programs such as nutrition and exercise can prevent HTN_a. Reports have indicated that children and adolescents often have insufficient physical activity and unbalanced nutrition over time [13,23]. Therefore, it is a critical period to reinforce policies for effective lifestyle improvements among children and adolescents in order to manage cardiometabolic diseases.
- A strength of this study that it analyzed meticulously collected nationwide data spanning from 2007 to 2021. This data was gathered through the KHANES, which has been in operation since 2007. Furthermore, we took into account causal pathways to prevent over-adjustment due to multiple variables. Notably, this is the inaugural study to assess the relationship between BMI_p and HTN_a in adolescents. In a previous study, Xu et al. [37] employed the Baron and Kenny method, which presents challenges in sensitivity analysis. However, we utilized a bootstrapping method to overcome this limitation, and we also conducted a sensitivity analysis.
- Nonetheless, this study has some limitations. First, it is a cross-sectional study, not a longitudinal one. Although we collected and analyzed data from 2007 to 2021, we were unable to examine data related to well-established risk factors for hypertension, such as sleep patterns and early childhood data [3]. Second, our secondary data did not include information on sleep-related characteristics or breastfeeding during infancy, both of which are significant risk factors for hypertension. Despite conducting a sensitivity analysis, the cross-sectional nature of our data makes it difficult to fully uphold the assumption of sequential ignorability. We performed the sensitivity analysis with these limitations in mind. While the results do offer some support for the sequential ignorability assumption, we acknowledge the challenge of providing definitive proof. Therefore, future cohort studies should aim to assess the distribution of blood pressure by age, examine early childhood data, and evaluate sleep data. Further studies comparing trends in blood pressure and BMI changes in children and adolescents will also be necessary.
- This study found that BMI_p exerted a significant effect on SBP_a through BMI_a. Thus, a high BMI_p, mediated through BMI_a, could be significantly associated with adolescent systolic hypertension. This suggests that special management may be required for this high-risk group. However, the study did not discuss the mediating effect of obesity on increasing children’s blood pressure.
DISCUSSION
SUPPLEMENTAL MATERIALS
Supplemental Material 4.
-
CONFLICT OF INTEREST
The authors have no conflicts of interest associated with the material presented in this paper.
-
FUNDING
None.
-
AUTHOR CONTRIBUTIONS
Conceptualization: Choi H. Data curation: Choi H. Formal analysis: Choi H. Funding acquisition: None. Methodology: Choi H. Project administration: Ahn YS. Visualization: Choi H. Writing – original draft: Choi H. Writing – review & editing: Lee H, Ahn YS.
Notes
ACKNOWLEDGEMENTS
- 1. Song YH. Hypertension in children and adolescents. J Korean Med Assoc 2020;63(7):404-409. (Korean)ArticlePDF
- 2. Jaworska N, MacQueen G. Adolescence as a unique developmental period. J Psychiatry Neurosci 2015;40(5):291-293ArticlePubMedPMC
- 3. de Simone G, Mancusi C, Hanssen H, Genovesi S, Lurbe E, Parati G, et al. Hypertension in children and adolescents. Eur Heart J 2022;43(35):3290-3301ArticlePubMedPDF
- 4. Khoury M, Urbina EM. Hypertension in adolescents: diagnosis, treatment, and implications. Lancet Child Adolesc Health 2021;5(5):357-366ArticlePubMed
- 5. Lurbe E, Agabiti-Rosei E, Cruickshank JK, Dominiczak A, Erdine S, Hirth A, et al. 2016 European Society of Hypertension guidelines for the management of high blood pressure in children and adolescents. J Hypertens 2016;34(10):1887-1920ArticlePubMed
- 6. Kawabe H, Azegami T, Takeda A, Kanda T, Saito I, Saruta T, et al. Features of and preventive measures against hypertension in the young. Hypertens Res 2019;42(7):935-948ArticlePubMedPMCPDF
- 7. Riley M, Hernandez AK, Kuznia AL. High blood pressure in children and adolescents. Am Fam Physician 2018;98(8):486-494PubMed
- 8. Lee EY, Yoon KH. Epidemic obesity in children and adolescents: risk factors and prevention. Front Med 2018;12(6):658-666ArticlePubMedPDF
- 9. DeBoer MD. Assessing and managing the metabolic syndrome in children and adolescents. Nutrients 2019;11(8):1788ArticlePubMedPMC
- 10. Hertzler AA. Obesity--impact of the family. J Am Diet Assoc 1981;79(5):525-530PubMed
- 11. Cho H, Kim JH. Secular trends in hypertension and elevated blood pressure among Korean children and adolescents in the Korea National Health and Nutrition Examination Survey 2007-2015. J Clin Hypertens (Greenwich) 2020;22(4):590-597ArticlePubMedPMCPDF
- 12. Oh JW, Lee EY, Lim J, Lee SH, Jin YS, Song BK, et al. Results from South Korea’s 2018 Report Card on physical activity for children and youth. J Exerc Sci Fit 2019;17(1):26-33ArticlePubMed
- 13. Rossi L, Behme N, Breuer C. Physical activity of children and adolescents during the COVID-19 pandemic-a scoping review. Int J Environ Res Public Health 2021;18(21):11440ArticlePubMedPMC
- 14. Webb AL, Conlisk AJ, Barnhart HX, Martorell R, Grajeda R, Stein AD. Maternal and childhood nutrition and later blood pressure levels in young Guatemalan adults. Int J Epidemiol 2005;34(4):898-904ArticlePubMed
- 15. Ejtahed HS, Heshmat R, Motlagh ME, Hasani-Ranjbar S, Ziaodini H, Taheri M, et al. Association of parental obesity with cardiometabolic risk factors in their children: the CASPIAN-V study. PLoS One 2018;13(4):e0193978ArticlePubMedPMC
- 16. Ewald DR, Haldeman LA. Risk factors in adolescent hypertension. Glob Pediatr Health 2016;3: 2333794X15625159ArticlePubMedPMCPDF
- 17. Amiri P, Rezaei M, Jalali-Farahani S, Karimi M, Cheraghi L, Esbati R, et al. Risk of hypertension in school-aged children with different parental risk: a longitudinal study from childhood to young adulthood. BMC Pediatr 2021;21(1):352ArticlePubMedPMCPDF
- 18. Lawlor DA, Najman JM, Sterne J, Williams GM, Ebrahim S, Davey Smith G. Associations of parental, birth, and early life characteristics with systolic blood pressure at 5 years of age: findings from the Mater-University study of pregnancy and its outcomes. Circulation 2004;110(16):2417-2423ArticlePubMed
- 19. Whitaker RC, Wright JA, Pepe MS, Seidel KD, Dietz WH. Predicting obesity in young adulthood from childhood and parental obesity. N Engl J Med 1997;337(13):869-873ArticlePubMed
- 20. Kang Y, Kim J, Kim DY, Kim S, Park S, Lim H, et al. Association between dietary patterns and handgrip strength: analysis of the Korean National Health and Nutrition Examination Survey data between 2014 and 2017. Nutrients 2020;12(10):3048ArticlePubMedPMC
- 21. Kweon S, Kim Y, Jang MJ, Kim Y, Kim K, Choi S, et al. Data resource profile: the Korea National Health and Nutrition Examination Survey (KNHANES). Int J Epidemiol 2014;43(1):69-77ArticlePubMedPMC
- 22. Textor J, van der Zander B, Gilthorpe MS, Liskiewicz M, Ellison GT. Robust causal inference using directed acyclic graphs: the R package ‘dagitty’. Int J Epidemiol 2016;45(6):1887-1894ArticlePubMed
- 23. Bull FC, Al-Ansari SS, Biddle S, Borodulin K, Buman MP, Cardon G, et al. World Health Organization 2020 guidelines on physical activity and sedentary behaviour. Br J Sports Med 2020;54(24):1451-1462ArticlePubMedPMC
- 24. Park SH, Kim SN, Lee SH, Choe JS, Choi Y. Development of 9th revision Korean food composition table and its major changes. Korean J Community Nutr 2018;23(4):352-365. (Korean)ArticlePDF
- 25. Messerli FH, Williams B, Ritz E. Essential hypertension. Lancet 2007;370(9587):591-603ArticlePubMed
- 26. Kopin L, Lowenstein C. Dyslipidemia. Ann Intern Med 2017;167(11):ITC81-ITC96ArticlePubMed
- 27. Imai K, Keele L, Tingley D, Yamamoto T. Comment on pearl: practical implications of theoretical results for causal mediation analysis. Psychol Methods 2014;19(4):482-487ArticlePubMed
- 28. Hayes AF, Scharkow M. The relative trustworthiness of inferential tests of the indirect effect in statistical mediation analysis: does method really matter? Psychol Sci 2013;24(10):1918-1927ArticlePubMedPDF
- 29. VanderWeele TJ. Explanation in causal inference: developments in mediation and interaction. Int J Epidemiol 2016;45(6):1904-1908ArticlePubMedPMC
- 30. Kelly RK, Magnussen CG, Sabin MA, Cheung M, Juonala M. Development of hypertension in overweight adolescents: a review. Adolesc Health Med Ther 2015;6: 171-187PubMedPMC
- 31. Bigazzi R, Zagato L, Lanzani C, Fontana S, Messaggio E, Delli Carpini S, et al. Hypertension in high school students: genetic and environmental factors: the HYGEF study. Hypertension 2020;75(1):71-78PubMed
- 32. Rasmussen L, Knorr S, Antoniussen CS, Bruun JM, Ovesen PG, Fuglsang J, et al. The impact of lifestyle, diet and physical activity on epigenetic changes in the offspring-a systematic review. Nutrients 2021;13(8):2821ArticlePubMedPMC
- 33. Abbasi J. The paternal epigenome makes its mark. JAMA 2017;317(20):2049-2051ArticlePubMed
- 34. Singh RK, Kumar P, Mahalingam K. Molecular genetics of human obesity: a comprehensive review. C R Biol 2017;340(2):87-108ArticlePubMed
- 35. Golan M, Crow S. Parents are key players in the prevention and treatment of weight-related problems. Nutr Rev 2004;62(1):39-50ArticlePubMed
- 36. Savage JS, Fisher JO, Birch LL. Parental influence on eating behavior: conception to adolescence. J Law Med Ethics 2007;35(1):22-34ArticlePubMedPMCPDF
- 37. Xu R, Zhang X, Zhou Y, Wan Y, Gao X. Parental overweight and hypertension are associated with their children’s blood pressure. Nutr Metab (Lond) 2019;16: 35ArticlePubMedPMCPDF
- 38. Basile JN. Systolic blood pressure. BMJ 2002;325(7370):917-918ArticlePubMedPMC
- 39. Sorof JM. Systolic hypertension in children: benign or beware? Pediatr Nephrol 2001;16(6):517-525ArticlePubMedPDF
- 40. Sorof JM. Prevalence and consequence of systolic hypertension in children. Am J Hypertens 2002;15(2 Pt 2):57S-60SArticlePubMed
 PubReader
 ePub Link
 Cite
Cite

